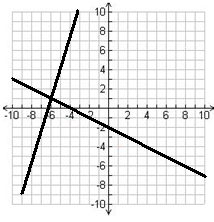
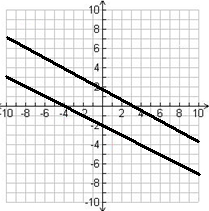
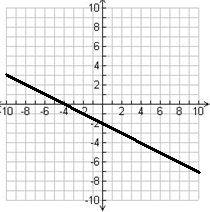
In order to determine the number of solutions to a system of linear equations, other than by finding the slope of the lines, we can also graph the equations out and look for the intersection of the lines.
Solving systems of linear equations by graphing
When studying linear algebra two topics are of utmost importance: Notation of matrices and vector fields. This lesson will focus on concepts which are the base to understand vector field mathematics, since you need to know how functions are graphed, what type of variables are involved on them and make sense of the meaning behind their visual representations.
Given that our lesson for today will focus on graphing equations, there is a basic concept you must understand: ordered pairs. An ordered pair is a set of two values usually written inside of a parenthesis and separated by a coma. The function of an ordered pair is to describe the position of a point in a graph providing the abscissa and the ordinate coordinate points.
In other words, to graph an equation and thus using graphing as a method to solve a system of linear equations, it is necessary to obtain the values of the abscissa and ordinate coordinates equivalent to the values of the variables x and y from the equations. Such array of values will then be written as an array of ordered pairs (,) which can be graphed.
On the first section of this lesson let us first look at the different algebraic methods that can be used to solve a system of equations, then, the second and third sections will focus on graphing.
How to solve system of equations
There are three different methods we use in algebra to solve a system of equations:
- By elimination
- By substitution
- By graphing
Solving systems of linear equations by elimination is one of the simplest methods. Its basic principle relies on adding or subtracting one equation from the other and thus quickly eliminate one of the two variables from the system so the variable that is left can be solved for automatically. Although this is probably the simplest method to use, is not always the most practical, and so it is left for systems with equations which contain the same coefficient on one of their variables. Examples of that can be seen in the lessons linked here.
The second method consists on solving systems of linear equations by substitution. Substitution means that we use one of the equations in the system to solve for one of its variables. Once you have an expression equal to the selected variable, you substitute this expression on the other equation in place of the variable so in that way, you end up with an equation in terms of the other variable which can be solved quickly to its final value.
The substitution method is considered to be the most difficult out of the three options, but as long as you follow the rule of: any operation done on one side of the equation, must be done to the other side this is the most used method by mathematicians. Substitution actually provides a basis for most of the algebraic methods to operate in any kind of mathematical function.
Our third method refers to solving systems of linear equations by graphing and is the topic we are covering in full today. For that, we start by explaining how an equation is graphed, to then finish our lesson with the method to solve systems of equations.
How to graph linear equations
In order for us to graph a linear equation we need to solve for the dependent variable.
For every equation with two variables, there will always be an independent variable and a dependent variable, as a standard in mathematics, our dependent variable is the one we call .
This means that the values takes depend on the value of at every point, always. This is the reason why we need an equation in the first place, since this will provide you with the exact relationship of with the values of since y is a function of .
And so, by solving for the dependent variable in an equation, meaning solving for , we can relate each point passes in a graph with its corresponding point with relation to the axis.
But what does solving for mean? In simple terms, we need to leave the variable along in one side of the equality from our given equation, so that the other side of the equality contains the specific relationship (or function) telling you how has to be operated on in order to obtain .
This is something you are probably already very familiarized with. And so, we will only enter into one simple example in order to review it.
If you have difficulties at any time do not worry, the exercices below will contain other examples on graphing equations, and so, you can practice many more times this throughout out lesson.
Having the equation:
We solve for by adding to both sides and then dividing by 2 to obtain:
Now, setting values to the independent variable (from negative to positive), we can compute the values of y related to them and produce a table containing the ordered pairs ready to be graphed as shown below:

Since this lesson is focused on solving systems of linear equations, the process of graphing linear equations as done in this section is repeated as many times as needed (once per each equation) on the system. Before continuing into solving system of equations in the next section make sure you visit the lesson on graphing linear functions using various forms to look into different techniques you can follow while making a graph for an equation. You can always select to work on problems with a different methodology than the one described here, we have selected to produce graphs this way since is the clearest and most specific method of organizing the data, but feel free to pick the way you feel most comfortable with to work, you can come back here and check your answers any time.
Solving systems by graphing
Now that you know how to graph equations, is time to look into solving systems by graphing. For this lesson, we will work with linear systems of two equations and two unknowns, in other words, there will be two variables (an independent = , and the dependent = ) in each system of two equations involving both of them.
As mentioned before, this will mean that you will have to graph two equations (and thus we will have a double table for each system). So let us explain how the solutions will come up and what type of solutions can we obtain from a system like the ones we will be working with:
First, it is important to know that when solving systems by graphing, the solution is found when an ordered pair is shared between the two equations. A shared ordered pair means that when both equations are graphed, they will intersect each other at a point and this point will be the shared ordered pair, thus this ordered pair will provide the solutions for x and y that correspond to such system. Take a look at the next example for a clear picture of this:
Example 1
Solve the system of equations shown below through the graphing method:
Solve for in each of the equations from the system:
produce:
Now let us make a table for the values of and for each of the equations:

Graphing the system to observe their behavior:

Notice from table two that both equations in the system share the ordered pair (-3, 3), if you go to the graph of both equations you can notice that the point at which intersect is this ordered pair coordinate of and , therefore this is the solution to our system of equations!
The rationale behind this technique is that when you graph and equation, each point in the graph represents a possible solution of this particular equation, then when having a system with more than one equation (in this case two), although each of the equations can have multiple solutions, the solution corresponding with the consistent system is that which agrees with both functions or in other words, a common point both equations share on the graph.
This takes us to realize there are two types of linear equations systems: consistent systems and inconsistent systems. Consistent systems will have at least one solution, thus, their lines on the graph will intersect at least once, while inconsistent systems of equations will not have a solution at all (the lines of the equations will never touch).
For that matter, when having a linear system consisting of two equations and two unknowns such as the ones we are working with there are three possible outcomes as you try to find their solutions:
You may find the have one solution, they may have an infinite amount of solutions or they might not have a solution at all. Therefore, the two first outcomes would correspond to a system which is consistent while the third case corresponds to an inconsistent system. And so, we conclude the linear equation system from example 1 is a consistent system since it has a solution.
When graphing systems of equations in the next exercises make sure you identify the type of system you have in each case, and the amount of solutions you have encountered.
Example 2
Solve system of equations shown below by graphing:
Find in each of the equations from the system:
produce:
Now we build the table in order to find all of the ordered pairs for the system of equations. As you can see, the second expression for y is very simple to obtain making our calculations faster. After we have found their corresponding values and wrote them down in the table, we graph this equation and its companion in graph 3 below:

Plotting the ordered pairs in the graph:

Thus, the system of equations found in example 2 is a consistent system with one possible solution for its and variables.
Example 3
Find the solution to the system of equations shown below through the graphing method:
Find in each of the equations from the system:
produce:
Constructing the table to obtain the ordered pairs:

As you can see there are no shared ordered pairs between the equations, the resultant plot is:

This means there are no solutions to this linear system of equations, and therefore, the system is inconsistent.
Example 4
Find the solution to the system of equations shown below through the graphing method:
Find in each of the equations from the system:
produce:
Is exactly the same expression for y in both equations! Thus we dont need a double table this time since we know we will obtain the exact same results for both of them!
We will keep the double table format just for illustrative purposes so we can mark all of the ordered pairs as shared:

How to graph a linear equation when its companion in the system is passing through the exact same points? Easy! You just have to plot one, since they will overlap, thus, graph the equation of the system (pick whichever of the two) to produce:

Therefore is obvious that the linear system of equations in example 4 is consistent and by having infinite solutions.
As you can see solving systems of equations by graphing happens to be a very simple way to understand algebra from the graphic point of view. By learning how to graph an equation from a linear system and directly observe what the unique answers of the system do, we obtain a meaningful basis for algebraic expressions and how they will be useful throughout diverse and more complicated areas of mathematics.
One Solution: Two linear equations intersect at one point. It is a consistent system of independent equation.

No Solution:Two linear equations are parallel to each other. It is an inconsistent system.

Infinite Solution:


No Solution:Two linear equations are parallel to each other. It is an inconsistent system.

Infinite Solution:


