Understanding Confidence and Significance Levels in Statistics
Dive into the world of statistical analysis with our comprehensive guide on confidence levels, significance levels, and critical values. Learn how to apply these concepts in real-world scenarios.

  1. Intros0/1 watched
  2. Examples0/9 watched
  3. Practice0/17 practiced
  1. 0/1
  2. 0/9
  3. 0/17
Now Playing:Confidence levels significance levels and critical values– Example 0
Intros
0/1 watched
  1. Using sample data, it is possible to find a Z-score relating to the claim (the test-statistic).

    Significance level

    Confidence Level (1α(1-\alpha)

    Significance Level (α\alpha)

    Critical Value (ZαZ_{\alpha})

    0.90

    0.10

    ?

    0.95

    0.05

    ?

    0.99

    0.01

    ?


    Left Tail Test:

    . Left tail test, confidence levels, significance levels and critical values

    Right Tail Test:

    . Right tail test, confidence levels, significance levels and critical values

    Two tailed Test:

    . Two tail test, confidence levels, significance levels and critical values

Examples
0/9 watched
  1. Finding the Critical Value
    With a significance level of α=0.075\alpha =0.075 what is the resulting critical value of:
    1. A right-tailed test?

    2. A left-tailed test?

    3. A two-tailed test?

Practice
0/17
Build your skill!Try your hand with these practice questions.
Null hypothesis and alternative hypothesis
Notes
Concept

Introduction to Confidence Levels, Significance Levels, and Critical Values

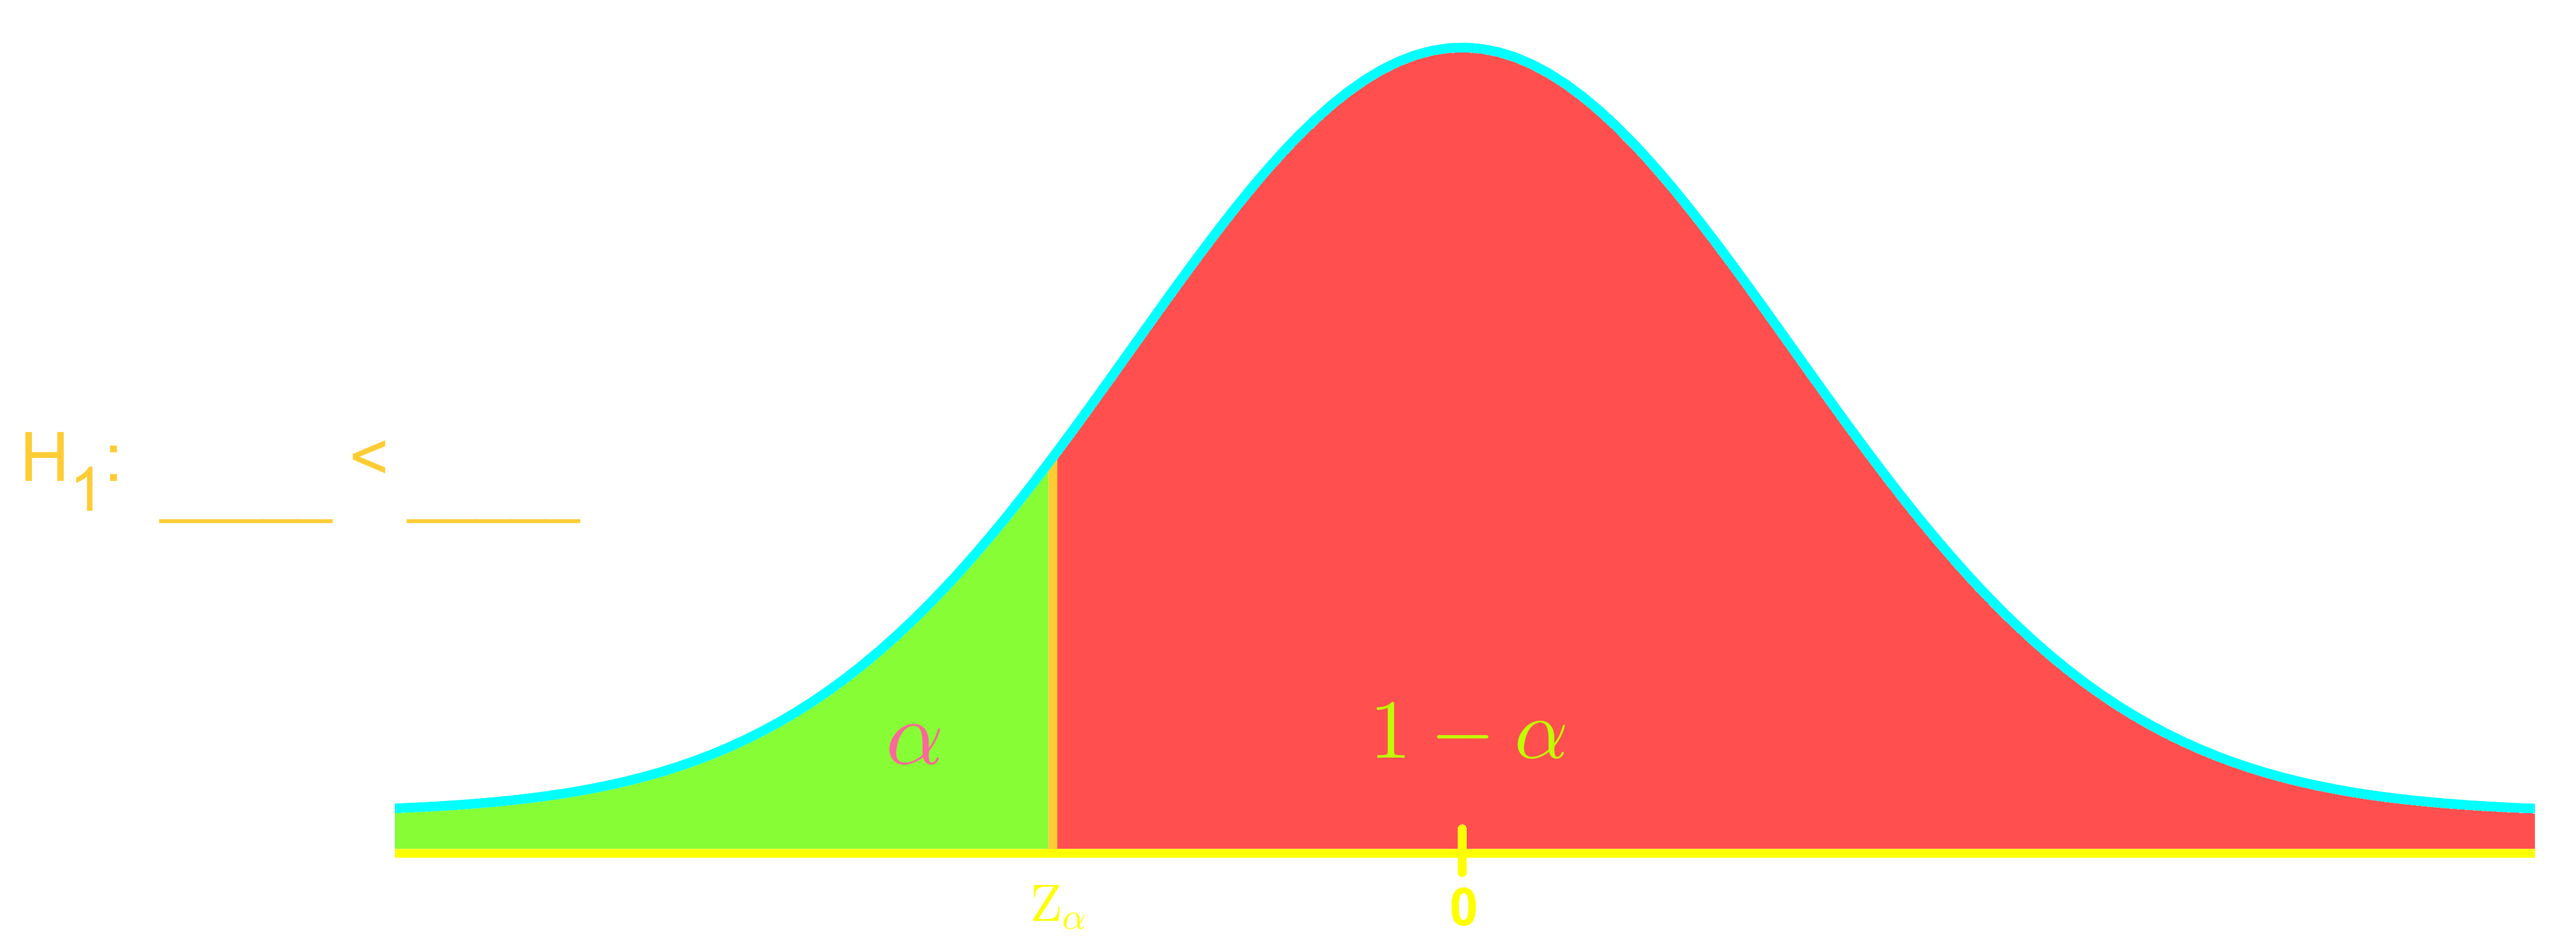
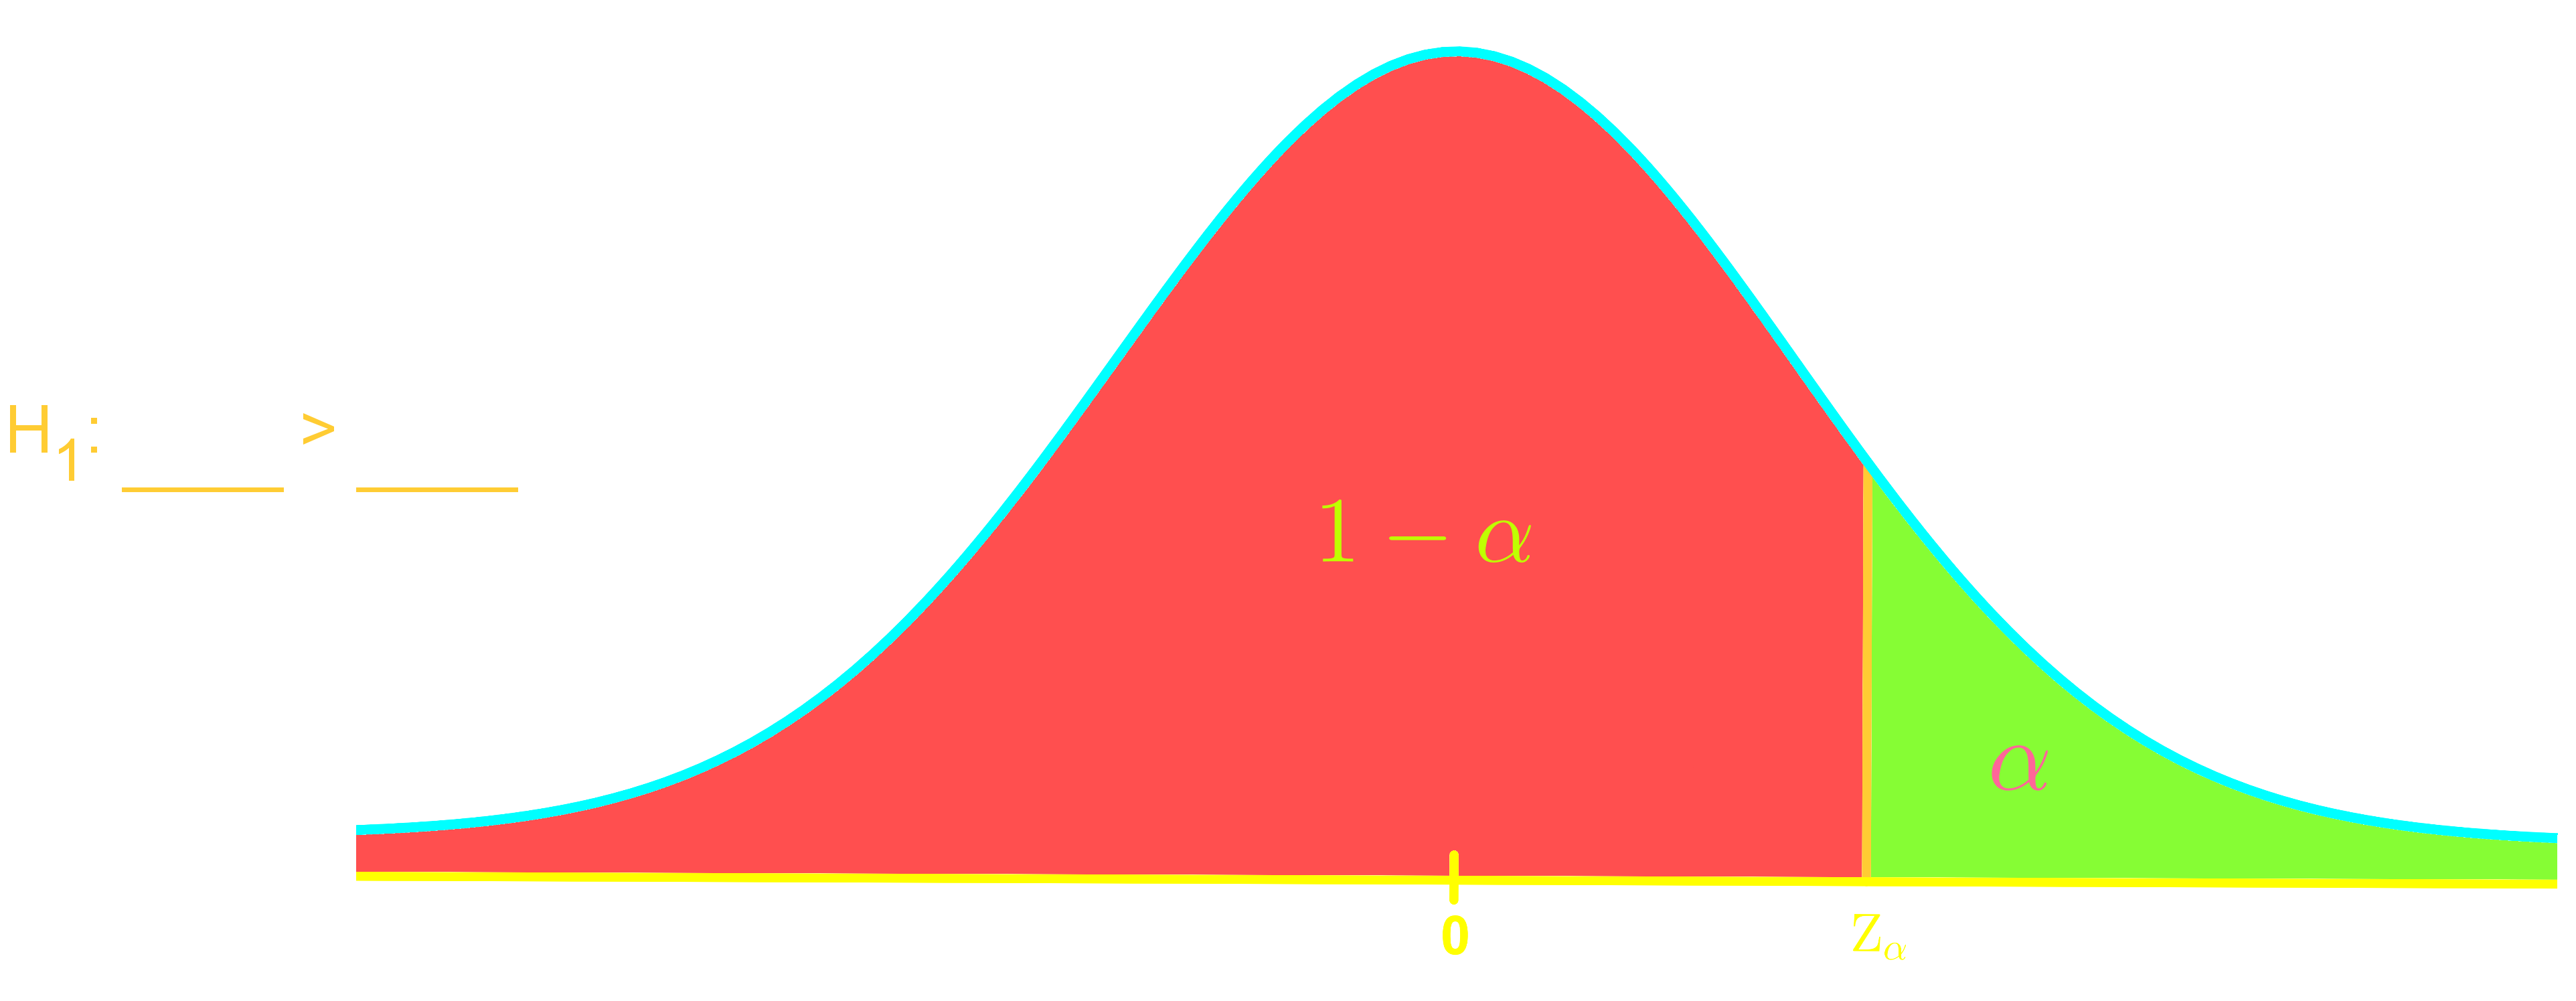
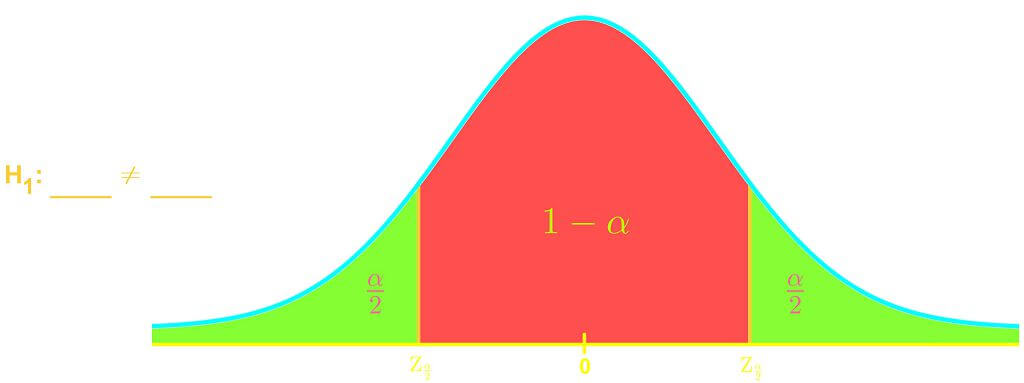
Welcome to our exploration of key concepts in hypothesis testing! In this section, we'll dive into confidence levels, significance levels, and critical values. These fundamental ideas form the backbone of statistical analysis. Our introduction video is a great starting point to grasp these concepts visually. Confidence levels tell us how sure we are about our results, typically expressed as percentages like 95% or 99%. Significance levels, often denoted as α (alpha), represent the probability of rejecting a true null hypothesis. Critical values are the boundaries that help us make decisions in hypothesis tests. They're closely linked to both confidence and significance levels. Understanding these concepts is crucial for interpreting statistical results accurately. As we progress, you'll see how these elements work together in hypothesis testing, allowing you to make informed decisions based on data. Remember, mastering these ideas takes practice, so don't hesitate to review the video and ask questions!

Example

Finding the Critical Value
With a significance level of α=0.075\alpha =0.075 what is the resulting critical value of:
A right-tailed test?

Step 1: Understanding the Significance Level

The significance level, denoted by α\alpha, is the probability of rejecting the null hypothesis when it is actually true. In this case, the significance level is given as α=0.075\alpha = 0.075. This means there is a 7.5% chance of making a Type I error, which is rejecting a true null hypothesis.

Step 2: Calculating the Confidence Level

The confidence level is complementary to the significance level. It is calculated as 1α1 - \alpha. For α=0.075\alpha = 0.075, the confidence level is:
10.075=0.9251 - 0.075 = 0.925
This means we are 92.5% confident in our test results.

Step 3: Understanding Right-Tailed Test

In a right-tailed test, the critical region (where we reject the null hypothesis) is on the right side of the distribution. The significance level α\alpha represents the area in the right tail of the distribution.

Step 4: Visualizing the Distribution

Imagine a normal distribution curve. The area to the left of the critical value represents the confidence level (0.925), and the area to the right represents the significance level (0.075). The critical value is the point on the x-axis that separates these two areas.

Step 5: Using the Z-Score Table

To find the critical value, we need to look up the z-score that corresponds to the cumulative area of 0.925 in the z-score table. The z-score table provides the area to the left of a given z-score.

Step 6: Finding the Z-Score

By looking up the area of 0.925 in the z-score table, we find that the corresponding z-score is approximately 1.44. This z-score is the critical value for our right-tailed test.

Step 7: Interpreting the Critical Value

The critical value of 1.44 means that if the test statistic (z-score) is greater than 1.44, we will reject the null hypothesis. This region to the right of 1.44 is known as the rejection region.

Step 8: Conclusion

In summary, for a right-tailed test with a significance level of α=0.075\alpha = 0.075, the critical value is 1.44. If the calculated z-score from the test is greater than 1.44, we reject the null hypothesis, indicating that the alternative hypothesis is likely true.

FAQs

Here are some frequently asked questions about confidence levels, significance levels, and critical values:

  1. What is the difference between a significance level and a confidence level?

    The significance level (α) is the probability of rejecting the null hypothesis when it's actually true. It's typically set at 0.05 or 0.01. The confidence level is the complement of the significance level (1 - α) and represents the probability that the true population parameter falls within the confidence interval. For example, a 95% confidence level corresponds to a 0.05 significance level.

  2. What is the significance level for a 95% confidence level?

    For a 95% confidence level, the corresponding significance level is 0.05 or 5%. This means there's a 5% chance of making a Type I error (rejecting a true null hypothesis).

  3. What confidence level corresponds to a 0.01 significance level?

    A 0.01 significance level corresponds to a 99% confidence level. This higher confidence level means we're more certain about our results, but it also requires a larger sample size and may increase the risk of Type II errors.

  4. How do you find the critical value for a 0.05 significance level in a two-tailed test?

    For a two-tailed test with a 0.05 significance level using the standard normal distribution (z-distribution), the critical values are approximately ±1.96. These values correspond to the points on the distribution that leave 2.5% in each tail.

  5. What does a 90% confidence interval mean?

    A 90% confidence interval means that if we were to repeat the sampling process many times and calculate the confidence interval each time, about 90% of these intervals would contain the true population parameter. It corresponds to a significance level of 0.10 and is less stringent than the commonly used 95% confidence level.

Prerequisites

Understanding confidence levels, significance levels, and critical values is crucial in statistical analysis, but to fully grasp these concepts, it's essential to have a solid foundation in several prerequisite topics. These fundamental concepts provide the necessary context and tools to comprehend and apply more advanced statistical techniques.

One of the key prerequisites is making a confidence interval. This concept is directly related to confidence levels, as it involves estimating a population parameter within a certain range. Understanding how to construct and interpret confidence intervals is vital for grasping the broader implications of confidence levels in statistical inference.

Another crucial prerequisite is the understanding of null hypothesis and alternative hypothesis. These concepts form the basis of hypothesis testing, which is intimately connected to significance levels. By comprehending how to formulate and test hypotheses, students can better appreciate the role of significance levels in decision-making processes within statistical analyses.

Knowledge of chi-squared hypothesis testing is also valuable. This specific type of hypothesis test introduces students to the practical application of significance levels and critical values in real-world scenarios, particularly when dealing with categorical data.

An introduction to normal distribution is fundamental to understanding confidence levels and critical values. The standard normal distribution serves as the foundation for many statistical tests and is crucial for determining critical values in various contexts.

The central limit theorem is another essential concept that underpins the use of normal distributions in inferential statistics. This theorem explains why many statistical procedures assume normality, which is critical when working with confidence levels and significance testing.

Lastly, understanding the margin of error is closely tied to confidence intervals and levels. This concept helps in quantifying the uncertainty in statistical estimates, which is crucial when interpreting confidence levels in various applications.

By mastering these prerequisite topics, students will be well-equipped to tackle the complexities of confidence levels, significance levels, and critical values. These foundational concepts provide the necessary context and tools to understand how statistical inferences are made, how to interpret results, and how to apply these principles in practical situations. As students progress in their statistical studies, they'll find that these prerequisites continually resurface, reinforcing their importance in the broader landscape of statistical analysis.