Stem-and-leaf plots
Intros
Lessons
Examples
Lessons
- Interpreting a Stem and Leaf Plot
A Stem and Leaf Plot representing the ages of people being immunized against a certain infection.
Stem:
Leaf:
0
145579
1
345569
2
001358
Write out a list of all the numerical data - Sandra's class brought all their animals into school one day. The weight of each animal was measured and then displayed in the following Stem and Leaf Plot:
Weight of Animal in Pounds
Stem:
Leaf:
0
1146778
1
0135
2
258
- Creating a Stem and Leaf Plot
A 100m swimming race took place and the time it took the competing swimmers to finish was recorded:
8.7 seconds
8.5 seconds
9.3 seconds
10.2 seconds
9.5 seconds
9.8 seconds
10.0 seconds
8.1 seconds
8.7 seconds
9.3 seconds
9.0 seconds
10.5 seconds
9.8 seconds
10.2 seconds
8.9 seconds
9.4 seconds
- Back-to-back Stem and Leaf Plot
It is often useful to consider two data sets to each other. A "Back-to-Back Stem and Leaf Plot" is a good way of handily comparing two distributions.
Meghan's basketball team has played two seasons so far. The amount of points her team scored in each game is given in the following back-to-back stem and leaf plot:
Amount of Points Scored
1st Season
2nd Season
467
7
88
017
8
369
38
9
47
05
10
1478
List the amount of points her team scored for all their games for each season. - Recognizing the leaf and stem of numbers
- Underline the leaf of the number
- 12
- 30
- 456
- Circle the stem of the number
- 7
- 89
- 231
- Write a number with:
- a stem of 0
- a leaf of 5
- a stem of 123.
- Circle the pairs of numbers with the same stem
- 61, 64, 74
- 23, 230, 235
- 1890, 189, 1899
- Which number would have the same number of digits?
- Two numbers with the same stem
- Two numbers with the same leaf
- Underline the leaf of the number
- Ordering numbers using a stem and leaf plot
Sort the data list using a stem and leaf plot26, 8, 4, 15, 7, 11, 19, 28, 23, 16 
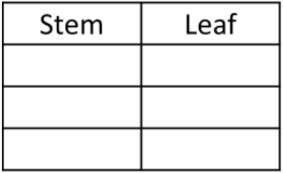
- What are the stems in the data set? Write them in order from least to greatest in the stem column of the plot.
- Write the leaves for the numbers into the stem and leaf plot.
- Order the leaves (digits) in each row from least to greatest
- Use the stem and leaf plot you have completed to list all the data values from least to greatest.
- Finding the mean, median, mode and range for a stem and leaf plot


