Probability with Venn diagrams
0/1
Intros
Lessons
0/15
Examples
Lessons
- Venn Diagrams Represent Events
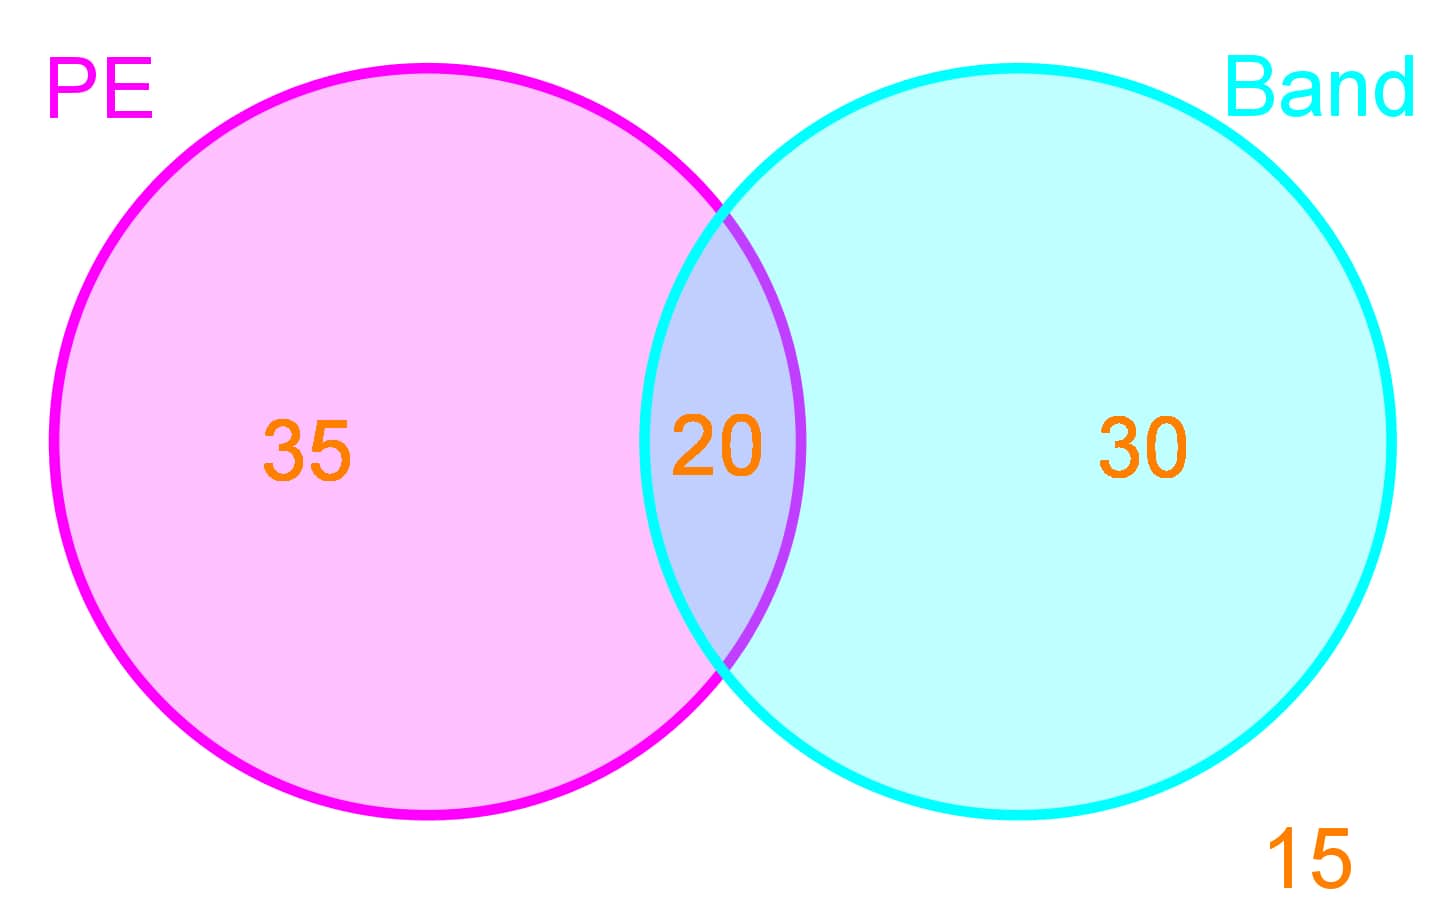
Out of a school of 100 students the number of students enrolled in PE and Band class is given below:

So there are 35 students who are taking only PE classes, 30 students who are taking only Band classes, and 20 students who are taking both PE and Band classes. There are also 15 students who are not enrolled in PE or Band classes. - Union and Intersection with Venn Diagrams
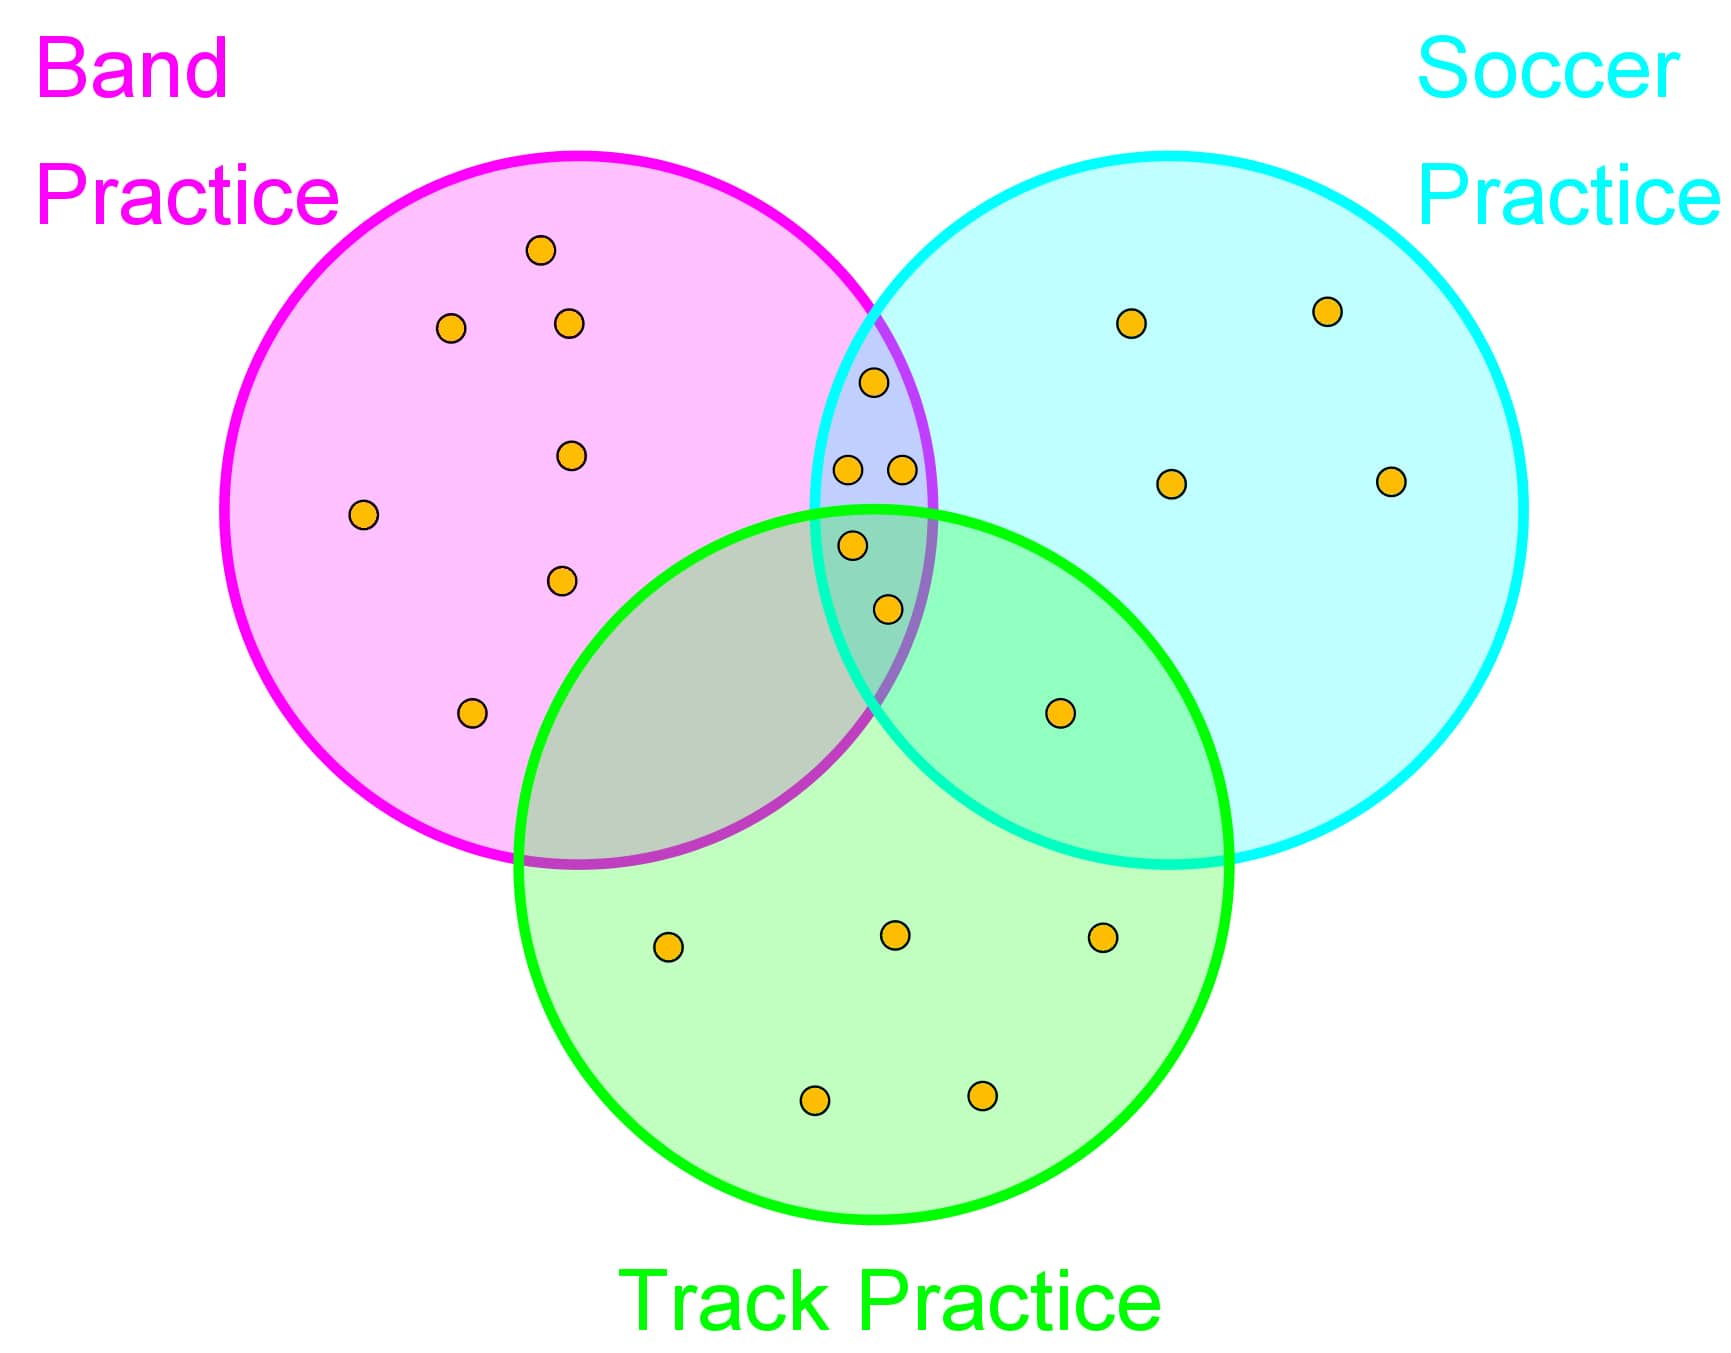
The following dots represent students who attend each after school activity:

- How many students attend only Band Practice, what is the probability of picking a student who attends only Band Practice?
- How many students attend Soccer Practice AND Band Practice, what is the probability of picking these students?
- How many students attend Soccer Practice AND Band Practice AND Track Practice, what is the probability of picking these students?
- How many students attend Track Practice OR Soccer Practice, what is the probability of picking these students?
- How many students attend Band Practice OR Soccer Practice, but not Track Practice? What is the probability of picking these students?
- Addition Rule
From a deck of cards 10 cards are drawn at random. From these 10 cards the probability of picking a king is 0.3 and the probability of picking a heart is 0.5. The probability of picking a card that is both a king and a heart (the king of hearts) is 0.1. - Determining the Complement of Events
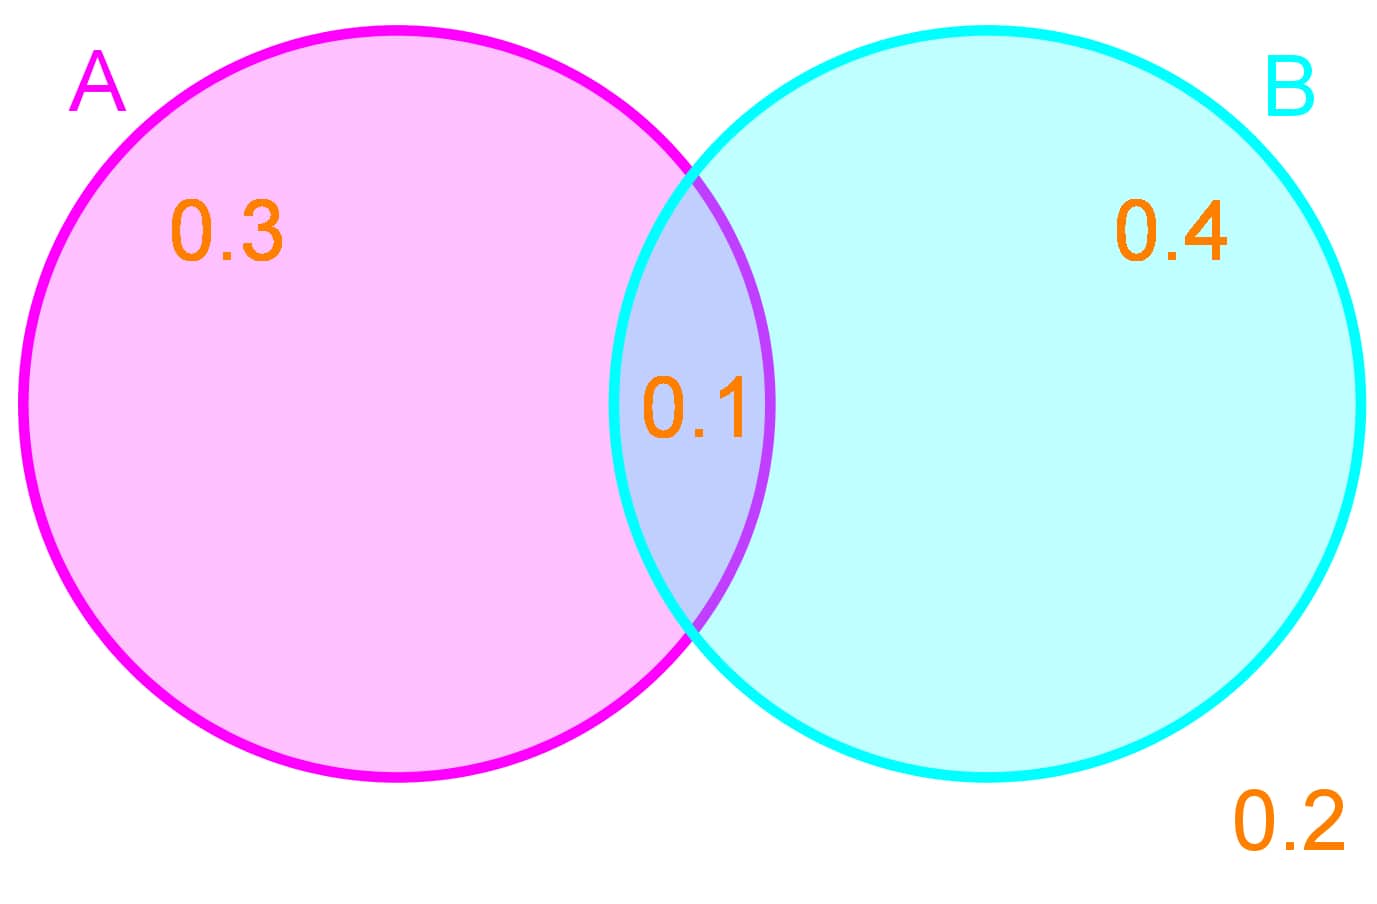
The probabilities of certain events are given in the Venn Diagram below:


