Intermediate Value Theorem
Before talking about the Intermediate Value Theorem, we need to fully understand the concept of continuity. This is because the intermediate value theorem requires the function to be continuous in order for the theorem to work.
How to Tell if a Function is Continuous
How do we define continuity? A function is continuous if you are able to draw the curve without picking up your pencil. For example, you may draw a continuous graph to look like this.
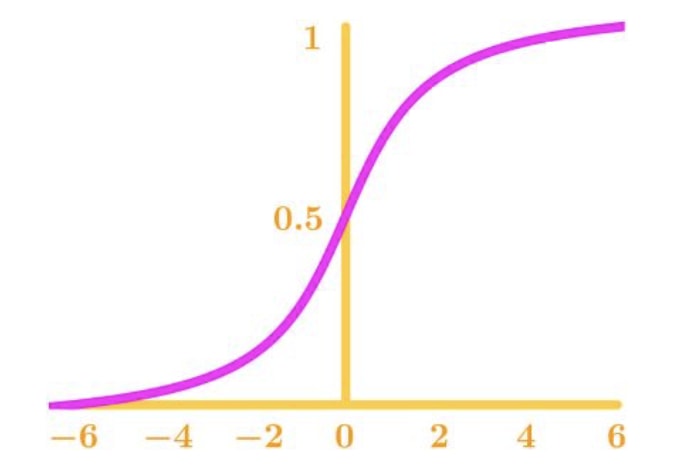
This would be a continuous function because it's a curve that does not break off in between, or have any open spaces.
Continuity vs Discontinuity
Now if by any chance you had to lift up your pencil, then that means the function is discontinuous. In a more mathematical sense, we use limits and continuity to determine where a function is discontinuous. Here are the three famous types of discontinuity you may encounter when lifting up your pencil:
Removable Discontinuity: There are two cases of removable discontinuity. The first case looks like the graph below.
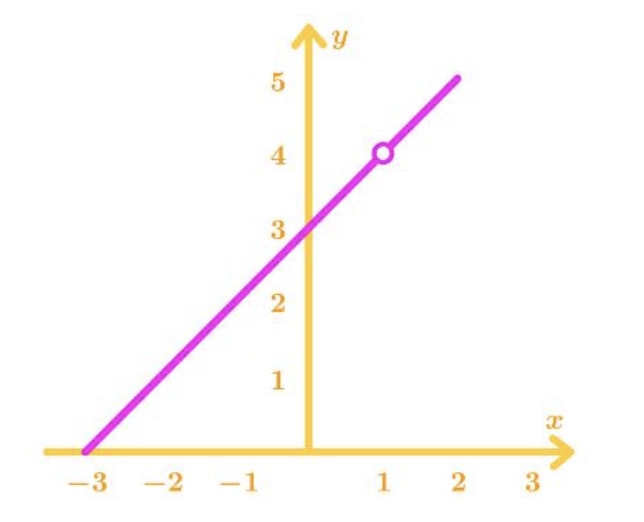
As you can see, there is a hole at x=1 of this function. We see that the two sided limit of the function at x=1 exist, but the value the function at x=1 does not exist. Therefore, we call this the point of discontinuity. The second case would look like this:
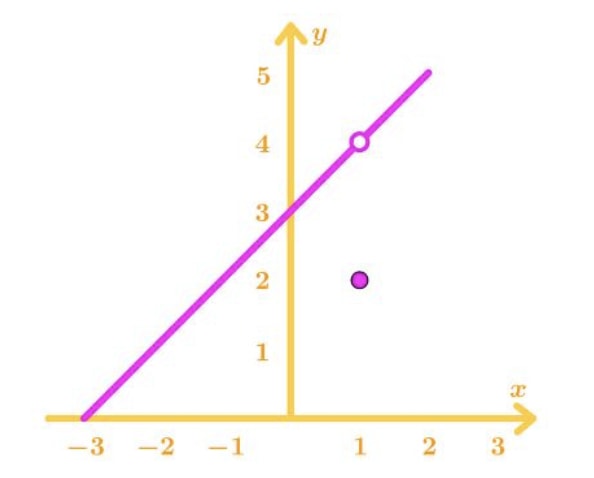
This is very similar to the first case, but now the value of the function at x=1 exists and it does not exist on the line. That means the value of the function at x=1 is not equal to the two sided limit of the function at x=1. If the limit does not exist, then that means there is a discontinuity at that point.
Infinite discontinuity: This happens when one of the one sided limits of the function goes to positive or negative infinity. In most cases, this happens when there is a vertical asymptote. An example of this is in the graph below:
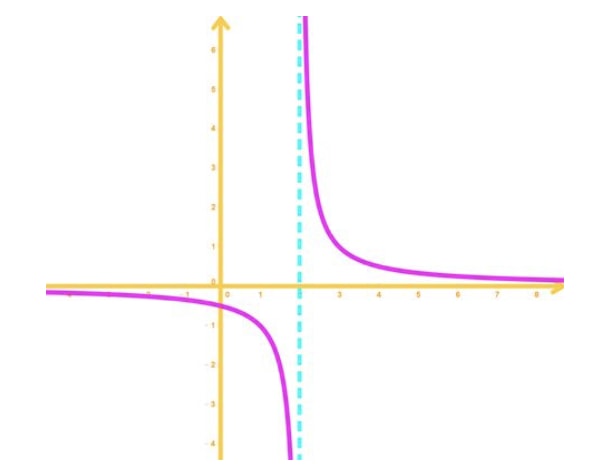
On the graph, the vertical asymptote happens at x=2. Notice when the limit as x approaches to 2 from the left, the function goes to negative infinity. In addition when the limit as x approaches to 2 from the right, the function goes to positive infinity. This type of discontinuity is also known as a non-removable discontinuity as well.
Finite discontinuity: This happens when the two sided limits do not exist, but both the one sided limits exist and are not equal to each other. Here is an example of a graph below:
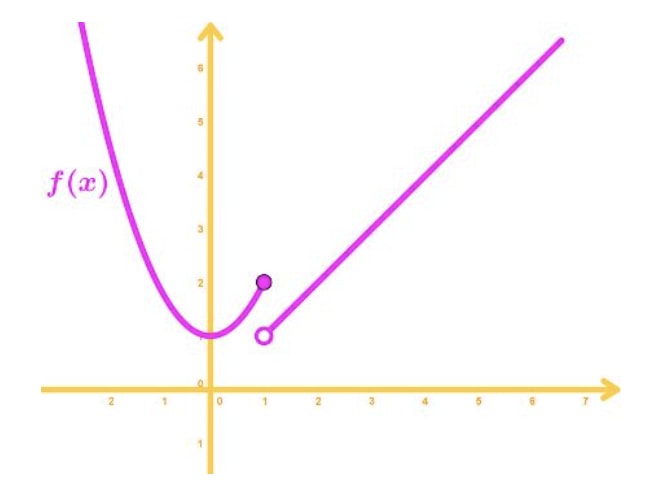
Notice that the limit as x approaches to 1 from the left is equal to 2, but the limit as x approaches to 1 from the right is equal to 1. Hence if we take a two sided limit at 1, then it will not exist. This type of discontinuity is sometimes referred to as jump discontinuity. It is easier to remember it this way since there is a "jump" to the function.
There are a few more types of discontinuities such as endpoint discontinuity and mixed discontinuity. You can check those out at the link below:
http://www.mathwarehouse.com/calculus/continuity/what-are-types-of-discontinuities.php
Now that we know more about continuity, we can go ahead and talk about the intermediate value theorem.
What is the Intermediate Value Theorem
The intermediate value theorem says the following:
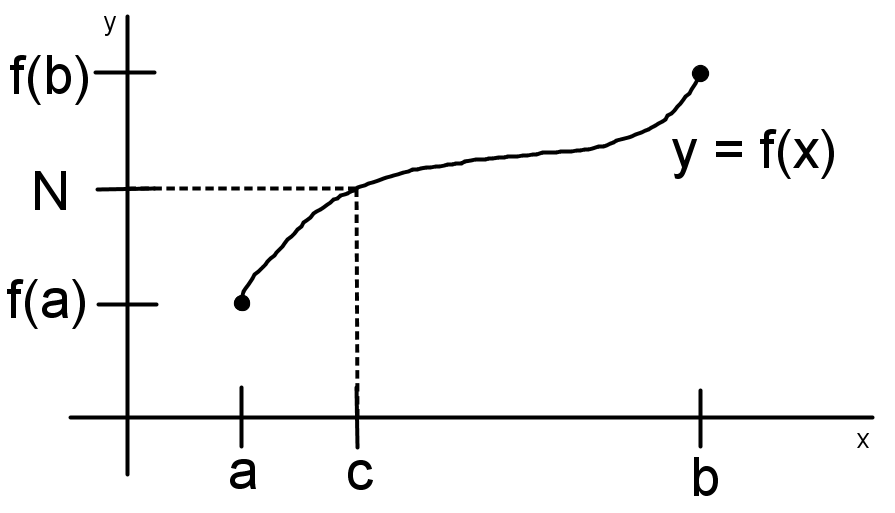
Suppose f(x) is continuous in the closed interval [a,b] and N is a number between f(a) and f(b) . Then there exists at least a number c where a < c < b, such that f(c) = N. To visualize this, look at this graph.
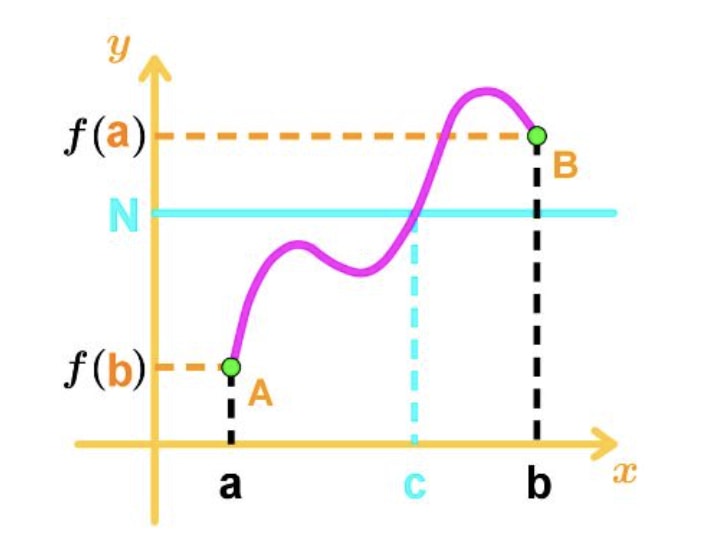
See that N is between f(a) and f(b), and also a < c < b. Hence we know it is possible that f(c) = N.
Now let me try to explain the theorem as informal as possible. There are two points, and these two points are connected by a continuous function. Now imagine a straight horizontal line that is in between the two points. You should be visualizing something like this.
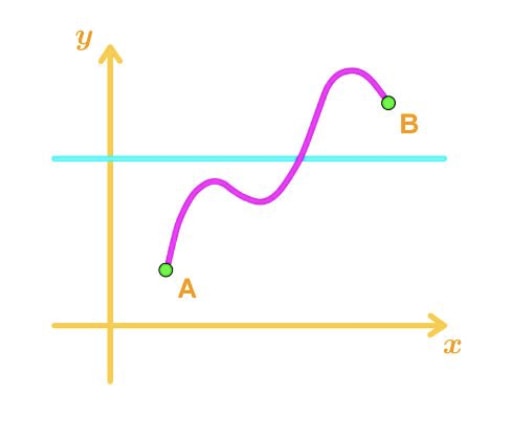
See that the horizontal line will always intersect the curve, and the intersection will create a point. Let's call it (c, N), and it is a point on the function. So we know that f(c)=N. So it will look something like this.

Notice how that a < c < b and f(a) < N < f(b). This is always the case! So the intermediate value theorem says that as long as the function is continuous, then there is also at least a number c such that a < c < b, and f(c)=N.
Now there is a possibility that more than one c value exists. For example, take a look at this graph.
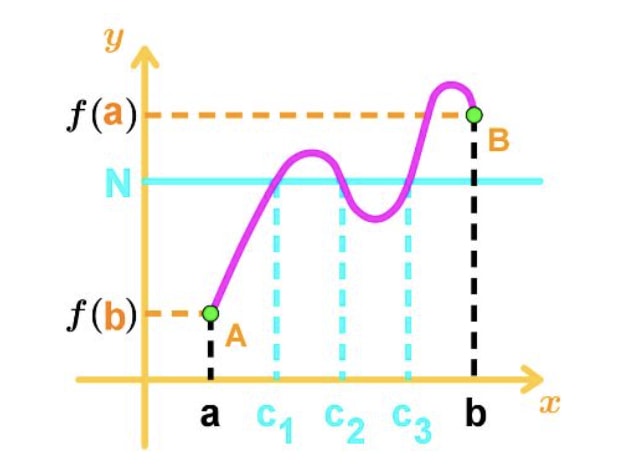
You can see that the function is still continuous, but the horizontal line intersects more points on the curves. Hence, this creates more c values that satisfy the intermediate value theorem.
If you are interested in other theorems such as Rolle's Theorem and Mean Value theorem, then I recommend you take a look at this link.
It talks about the difference between Intermediate Value Theorem, Rolle 's Theorem, and Mean Value Theorem. It also looks at Mean Value Theorem examples and Intermediate Value Theorem examples.

