Regression analysis
0/1
Intros
Lessons
0/8
Examples
Lessons
- Interpolation and Extrapolation
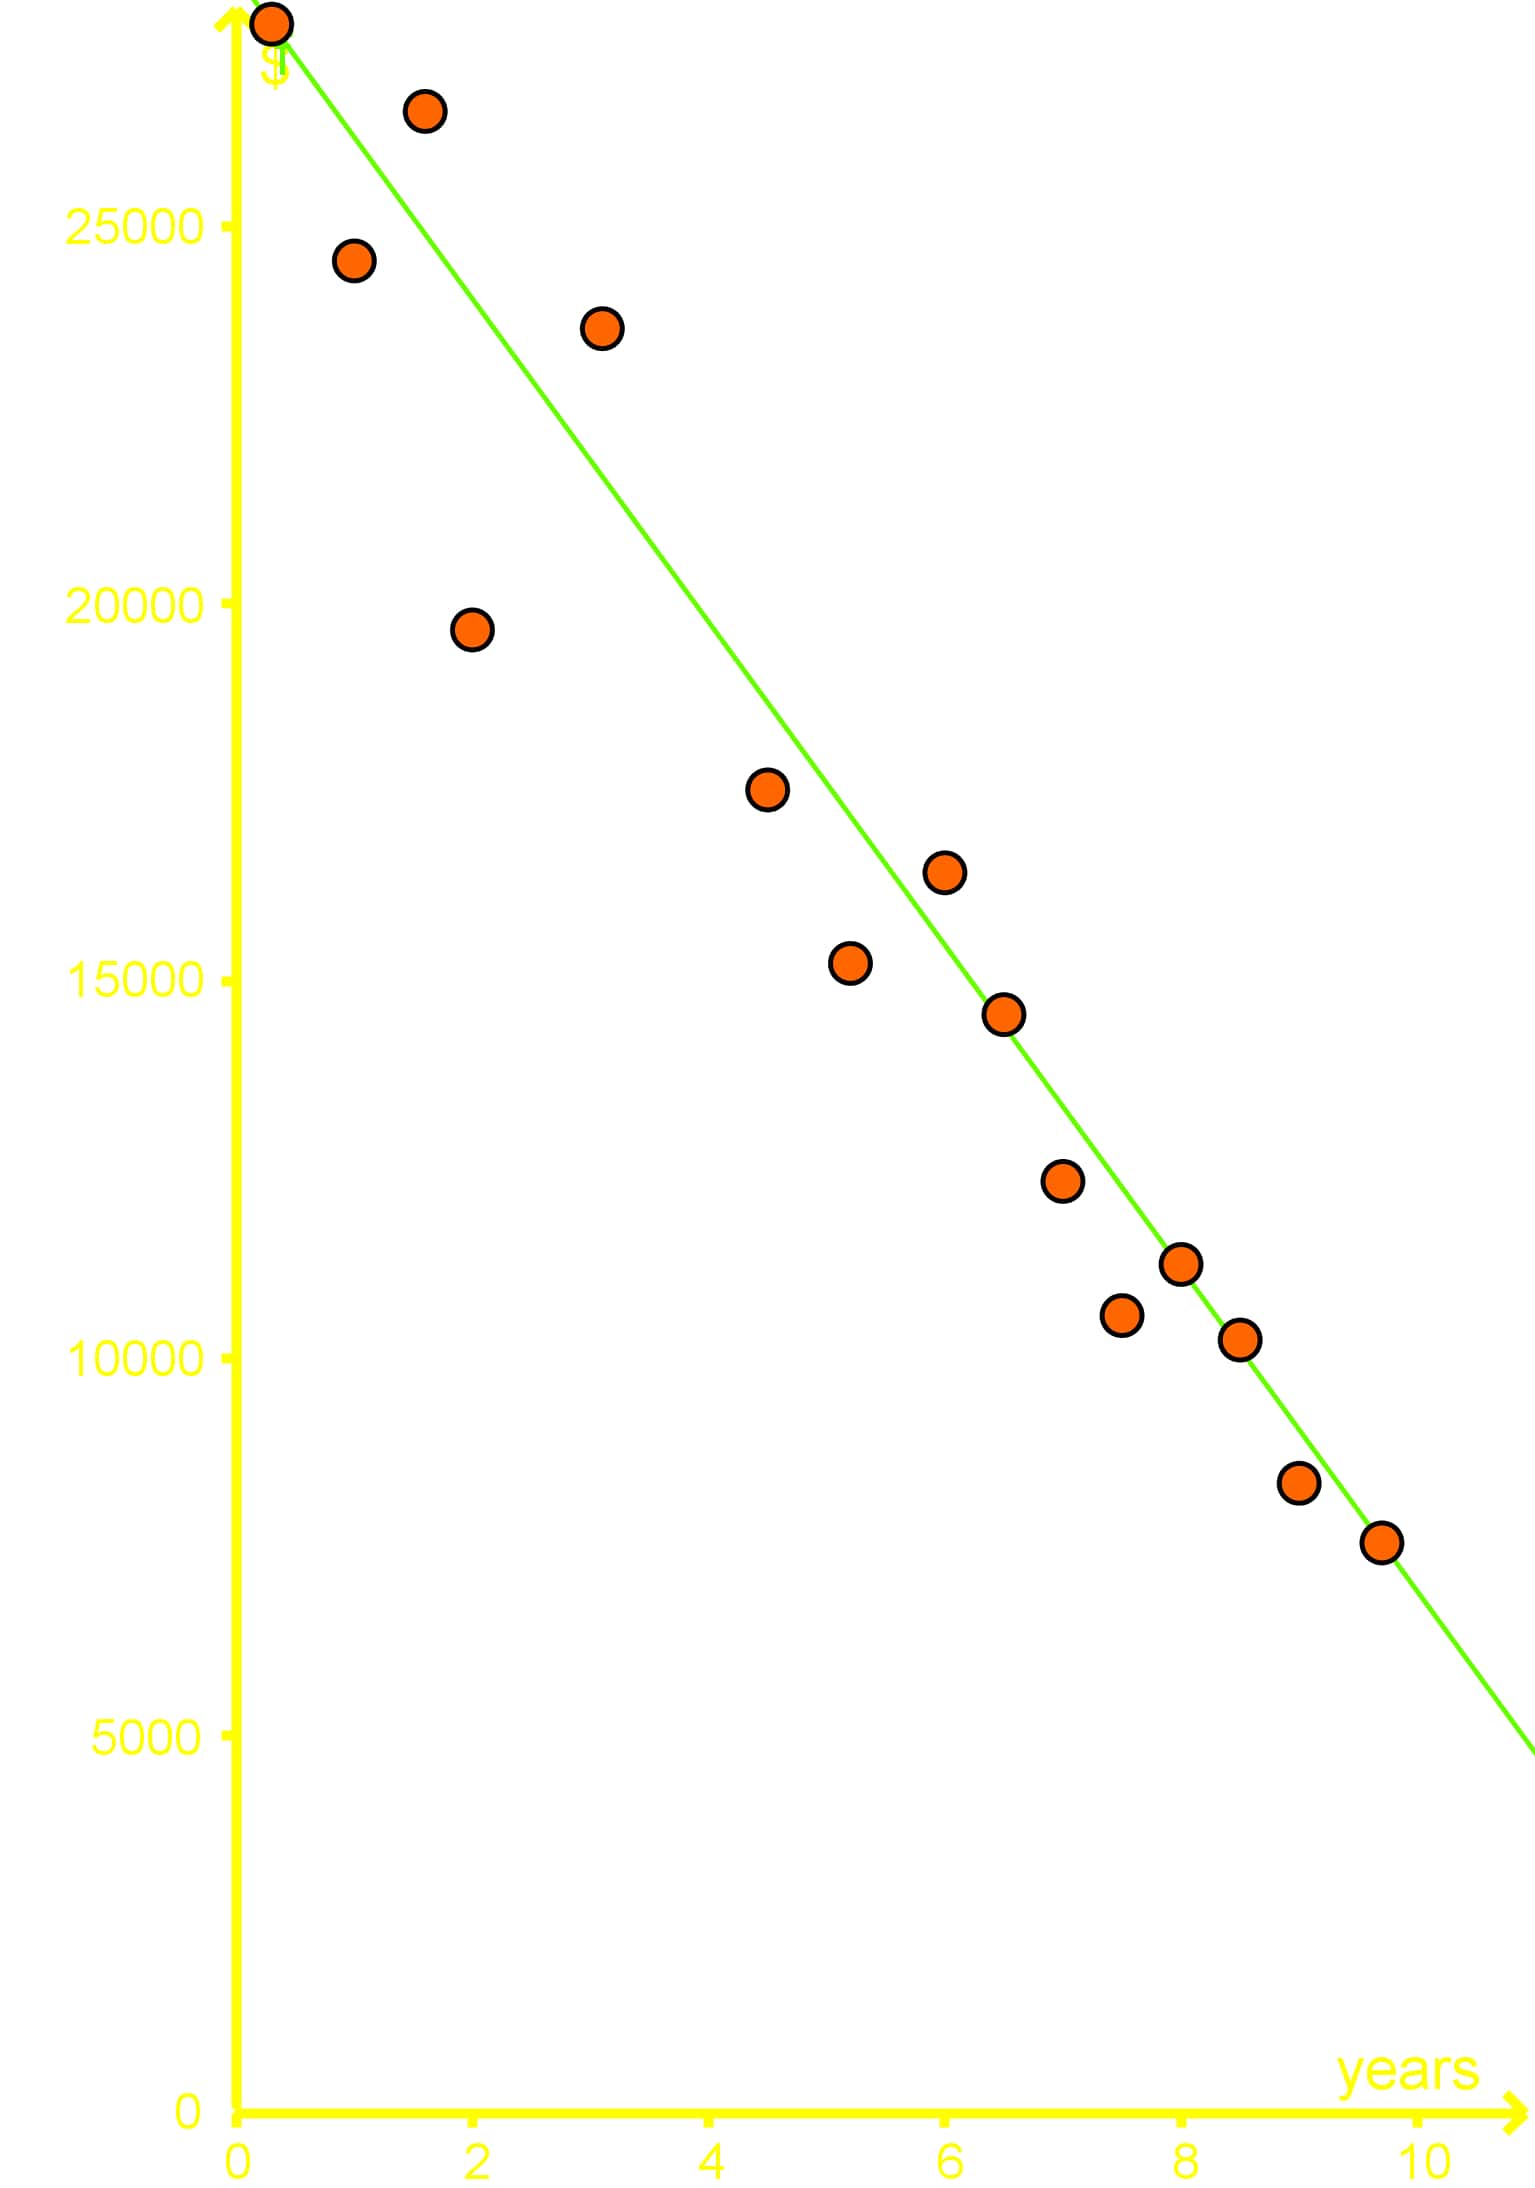
A study took a sample of 14 cars and found the age of each car and the amount of money that each car is worth. A best fit line is given by the equation , where y is the worth of the car in dollars and is the age of the car in years.
- A study was done on 17 factory workers on their coffee consumption and how many boxes they were able to move per hour. The results of this study are given in the graph below:
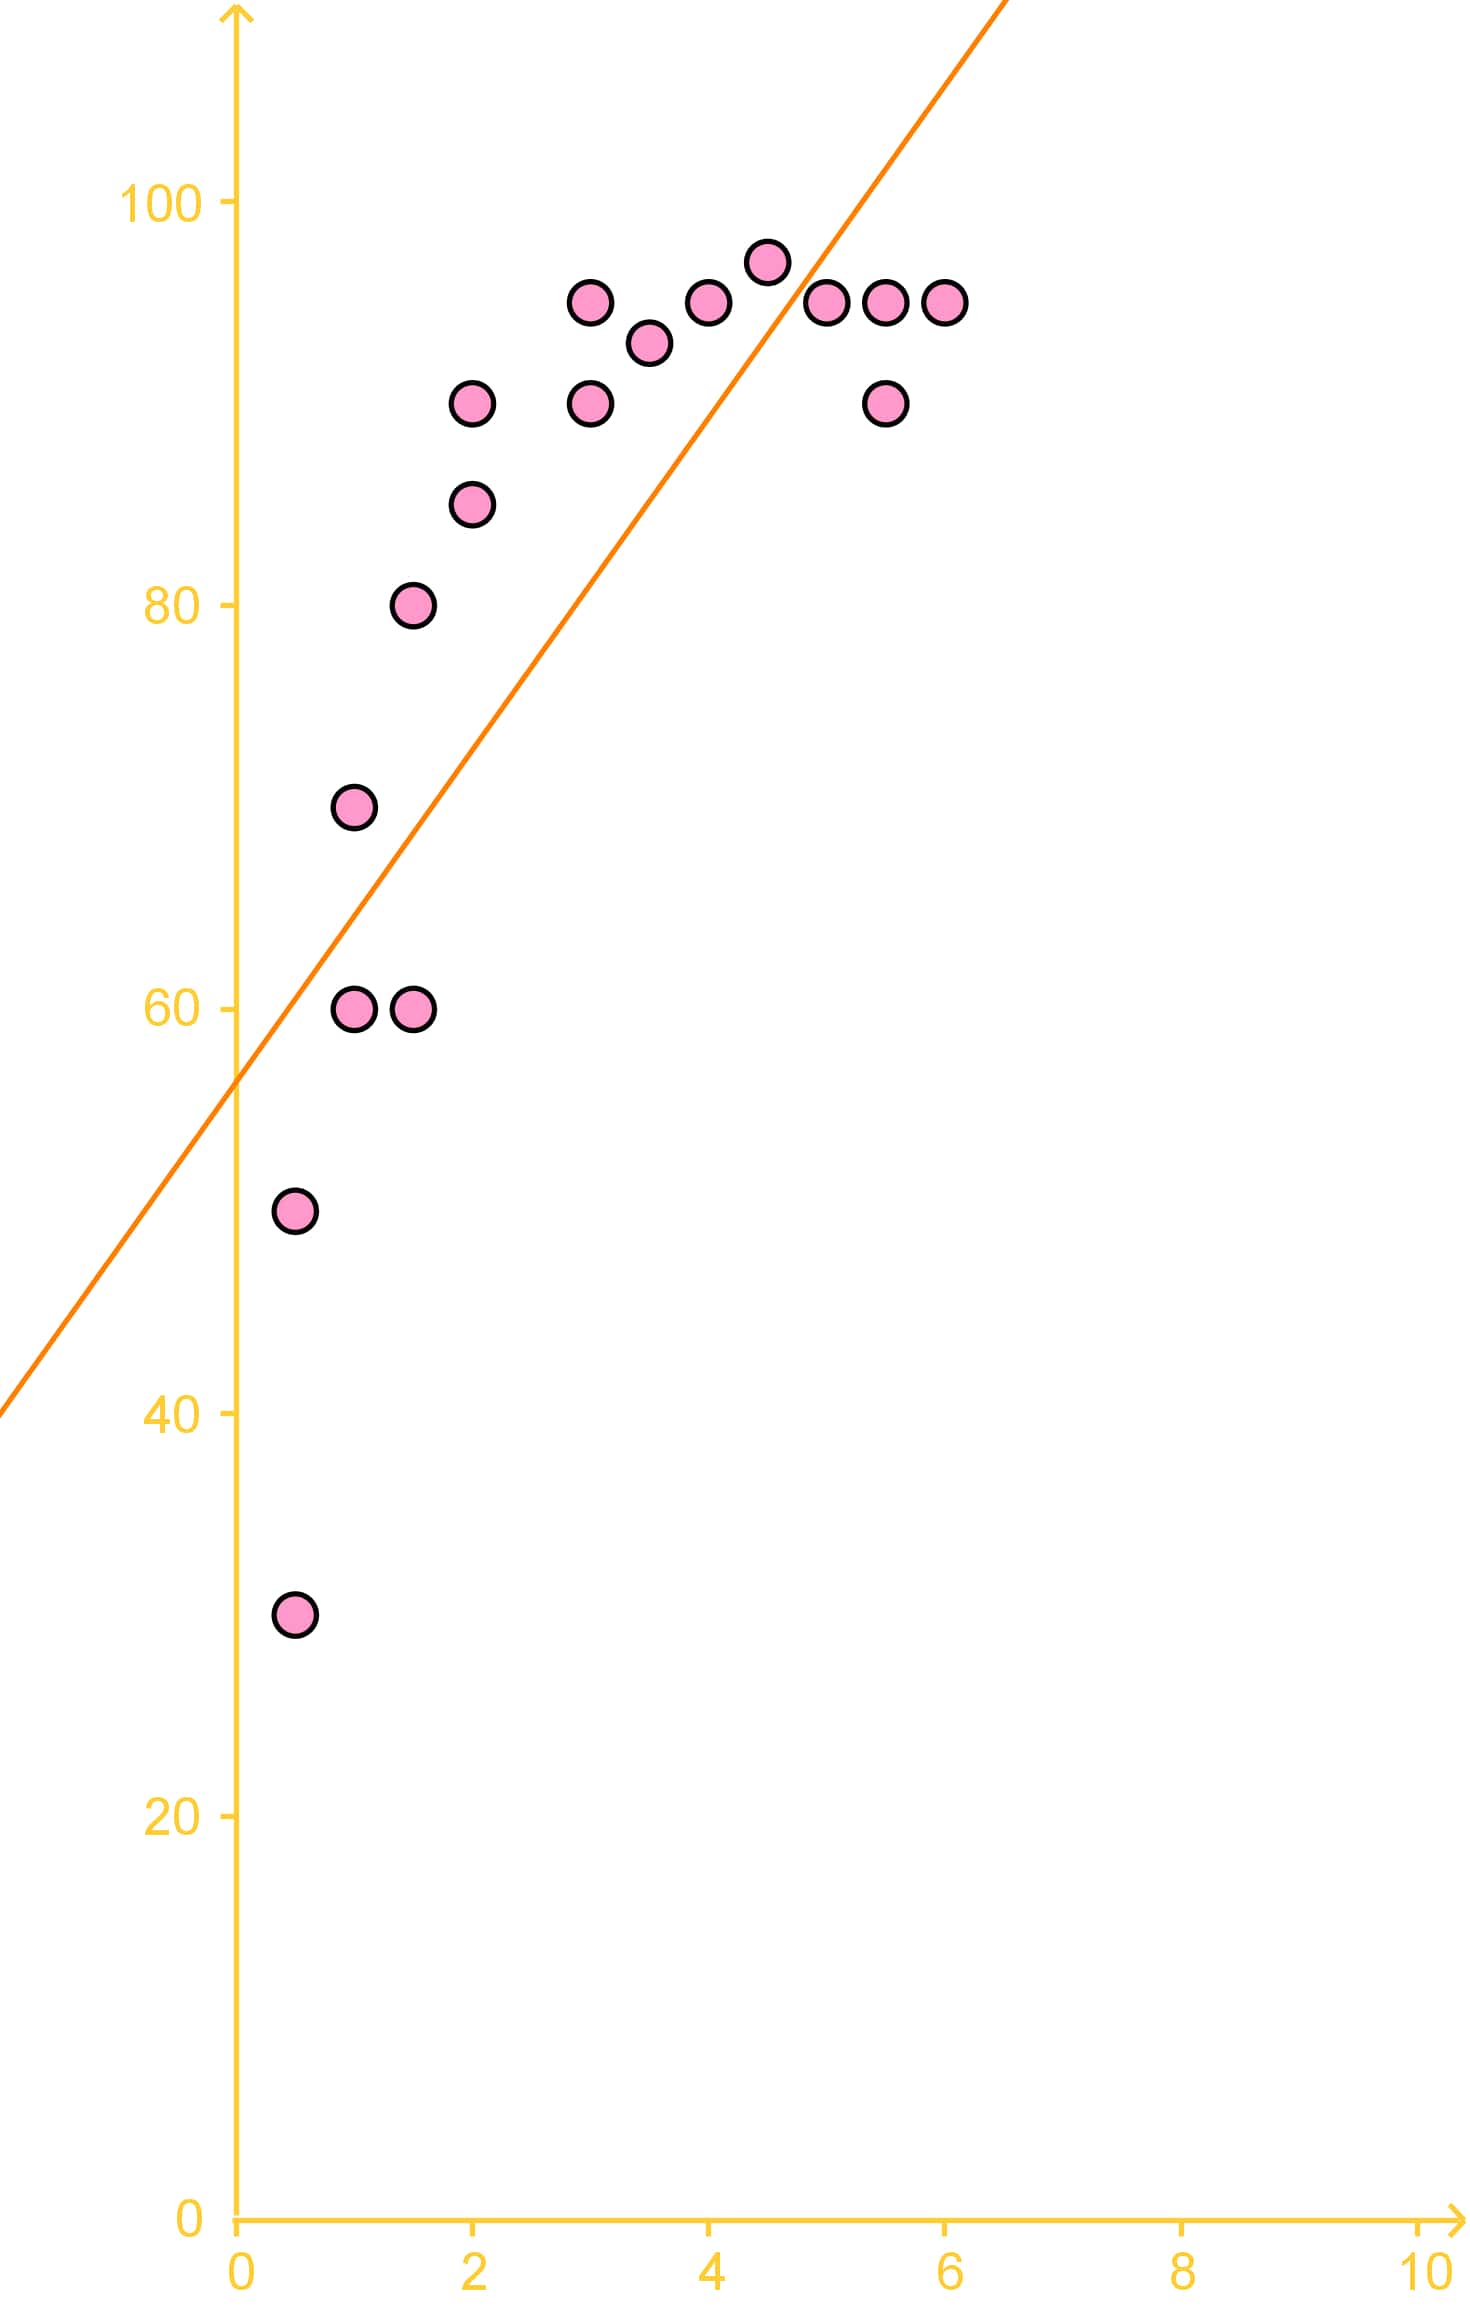
The trend line is given as: , with being the number of boxes moved per hour and being the number of coffees drunk. - Finding the Best Fitting Curve
- Plot the following bivariate data as a scatter plot, with the time spent on homework on the x-axis.
Time Spent on Homework
Grade in Class
2 hours
65%
8 hours
80%
13 hours
83%
15 hours
87%
19 hours
91%
24 hours
93%
- Make a line of best fit using the student who spent 8 hours on homework and the student who spent 15 hours studying
- Using the best fit line found in the previous part, estimate what mark a student would achieve in this class if they spent 14 hours on homework
- Plot the following bivariate data as a scatter plot, with the time spent on homework on the x-axis.