Linear relations are often expressed in graphs. In this
section, we will learn how to plot these data of linear relationships into graphs. We will also learn how to read and interpret the graphs to help us answer some word problems.
Examples
0/8 watched
The table below shows the relation of working time and the amount of money that John earns.
Time, t (hour)
1
2
3
4
5
6
Amount of money, m (dollar)
10.5
21
31.5
42
52.5
63
The table below shows the distance of a scuba diver diving underwater in relation to time.
Time, t (minute)
10
15
20
25
30
35
Distance from water surface, f (feet)
- 15
- 22.5
- 30
- 37.5
- 45
- 52.5
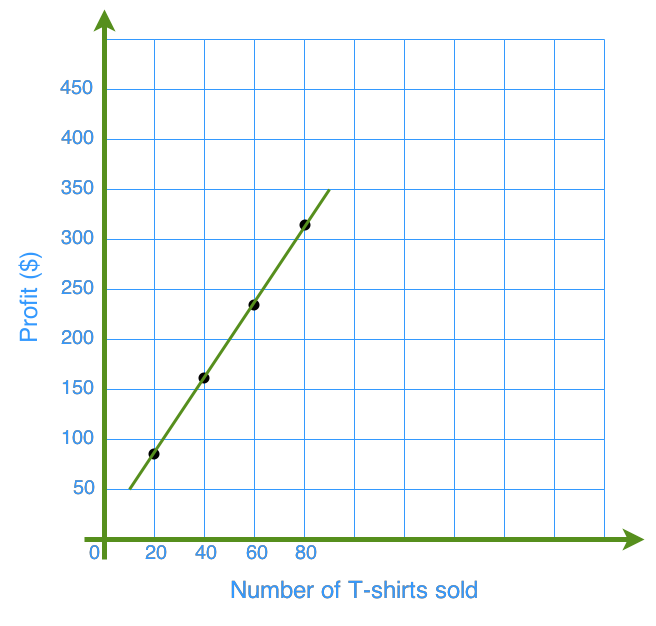
- An online clothing company can earn $4 for every t-shirt they sell.