Introduction to Reading and Drawing Histograms
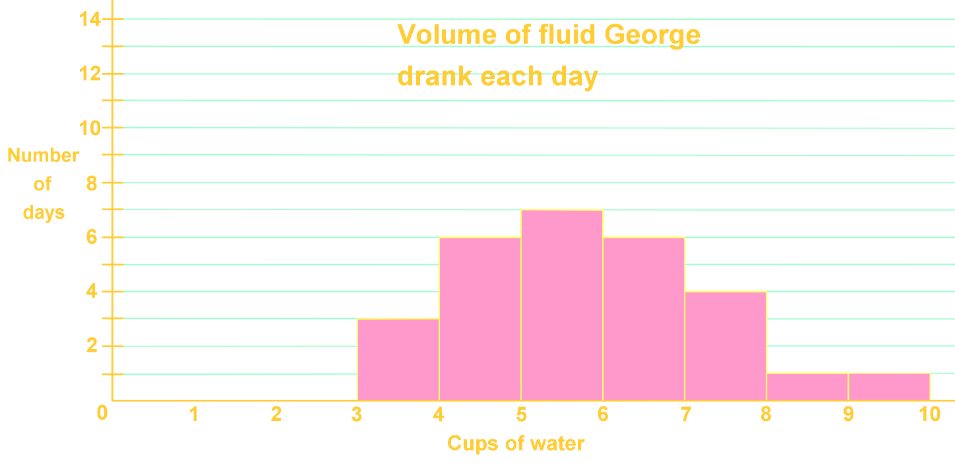
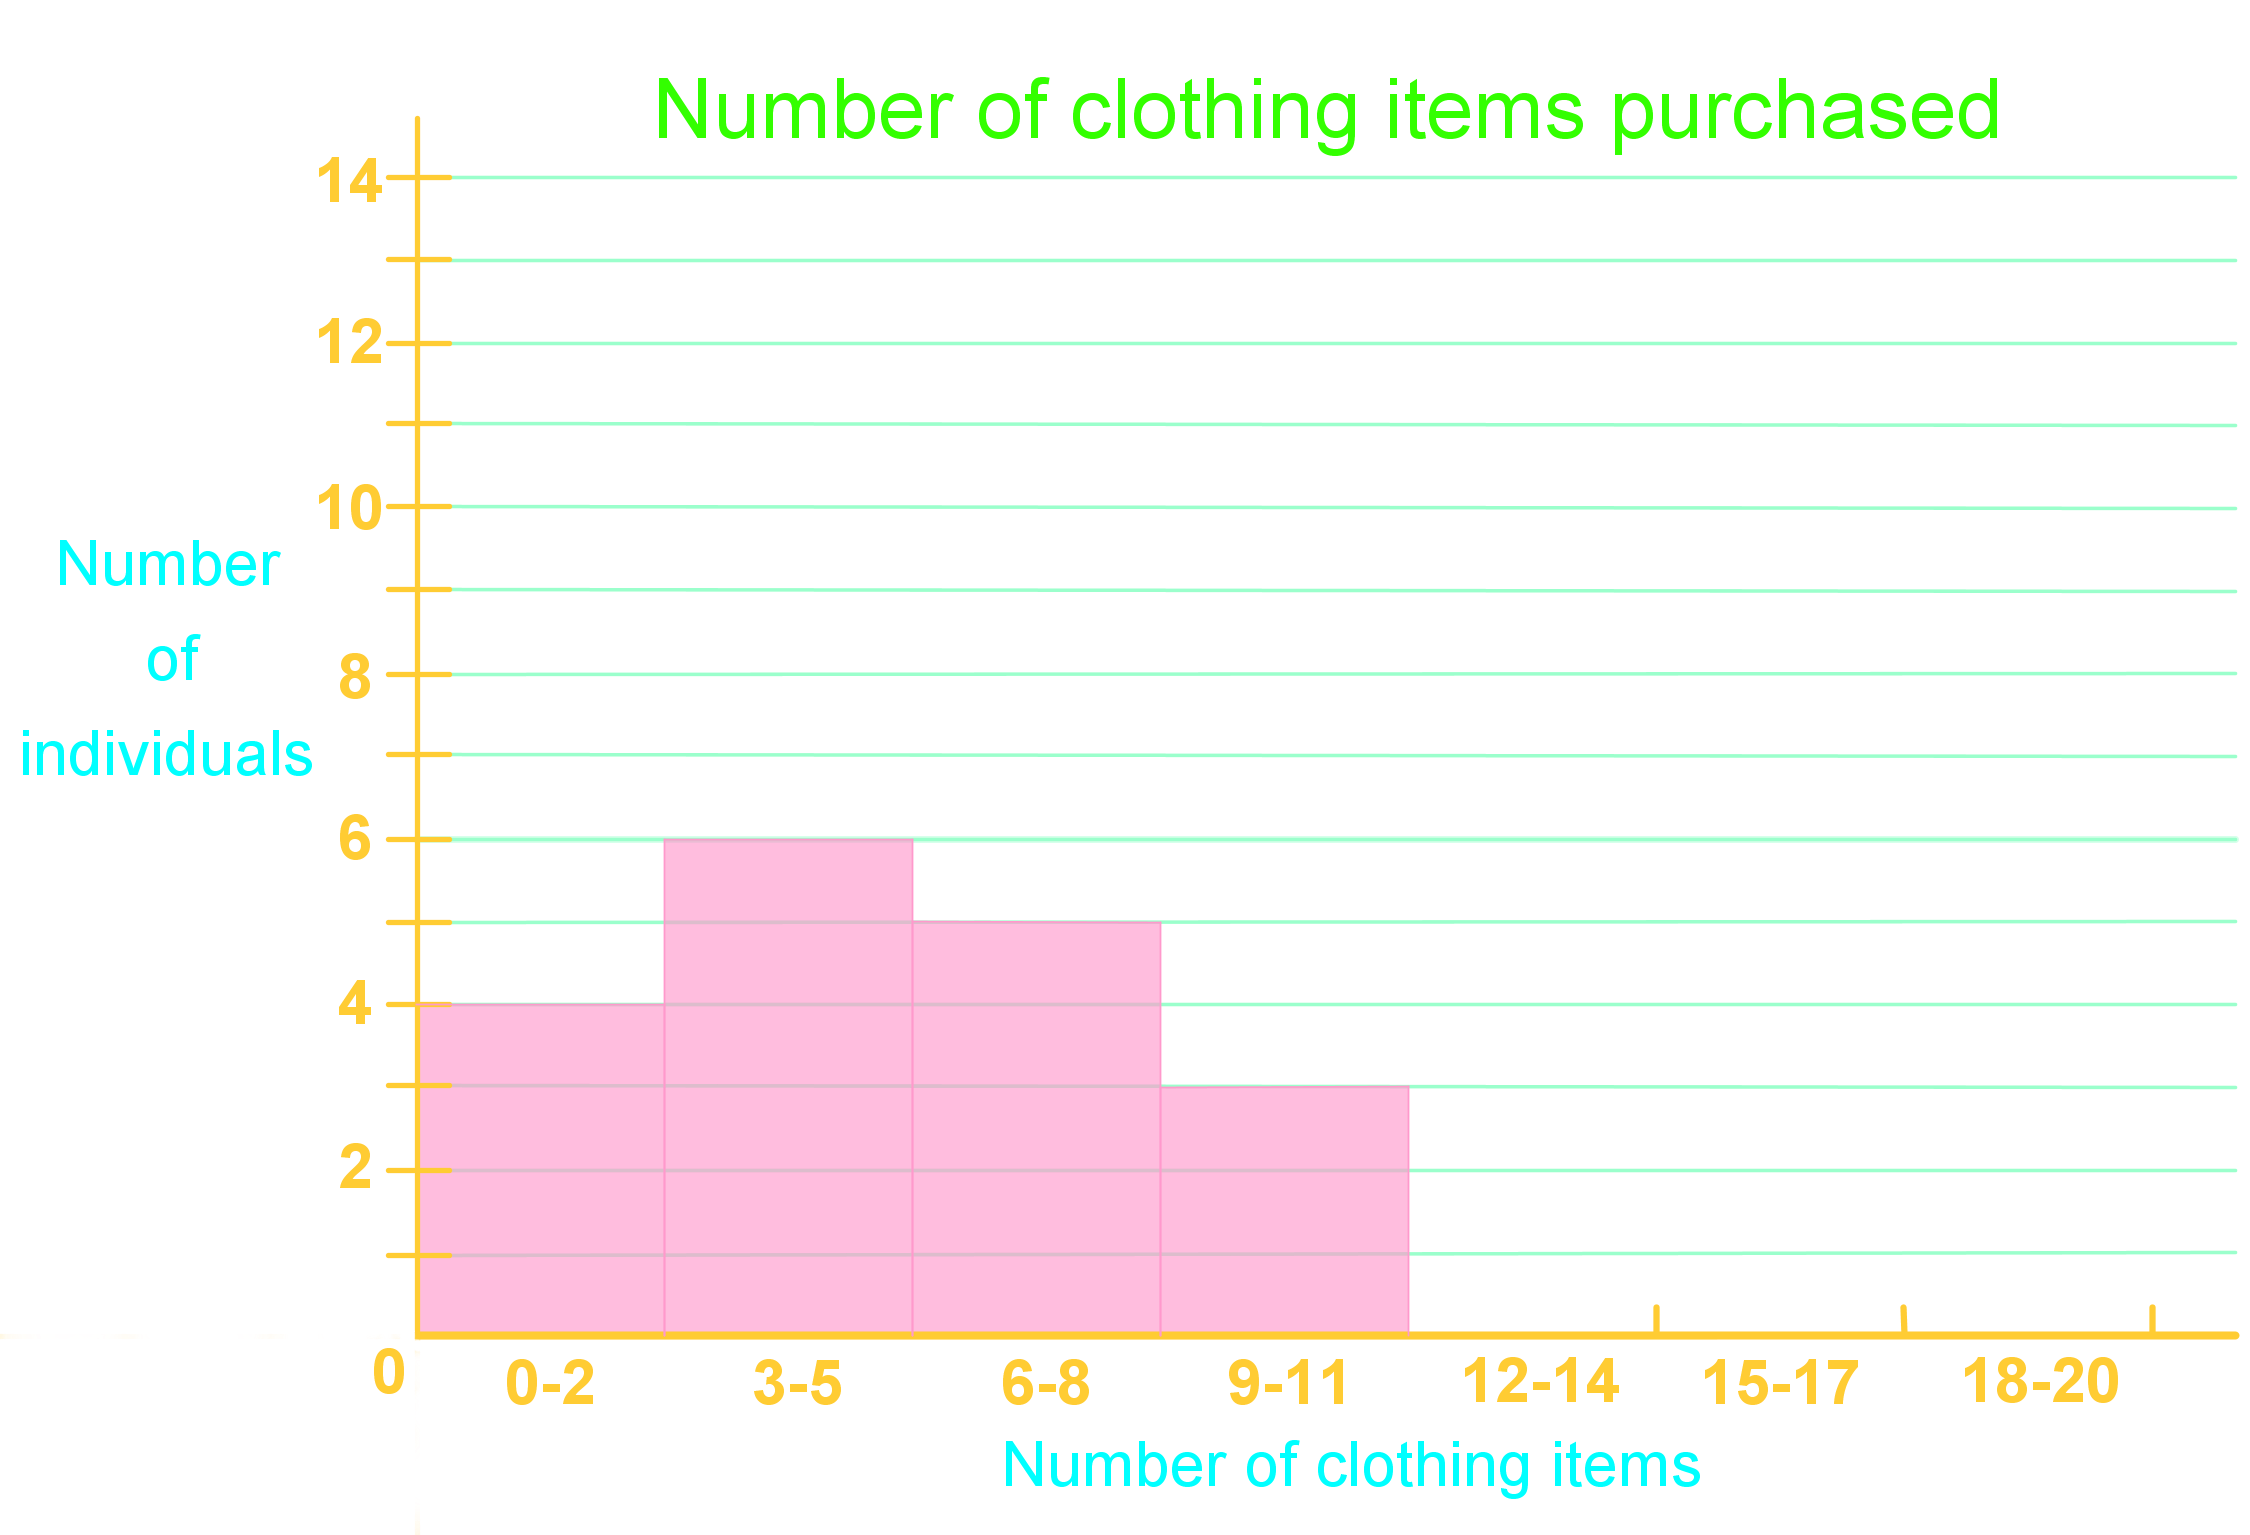
Histograms are powerful tools in data visualization, essential for representing continuous data distributions. Unlike bar graphs, which display discrete categories, histograms showcase the frequency of data points within specific intervals or bins. This unique feature makes histograms invaluable for analyzing patterns, identifying outliers, and understanding the shape of data distributions. In our introduction video, we'll explore the fundamentals of histograms and their significance in data analysis. You'll learn how to interpret histogram shapes, such as normal distribution histogram, skewed, or bimodal distributions, and how these shapes reveal crucial information about your dataset. We'll also discuss the key differences between histograms and bar graphs, emphasizing how histograms excel at representing continuous data like heights, weights, or temperatures. By mastering histograms, you'll gain a vital skill for effectively communicating complex data trends and making informed decisions based on data distributions.


