Reading and drawing Venn diagrams
0/1
Intros
Lessons
0/10
Examples
Lessons
- Reading Information from Venn Diagrams
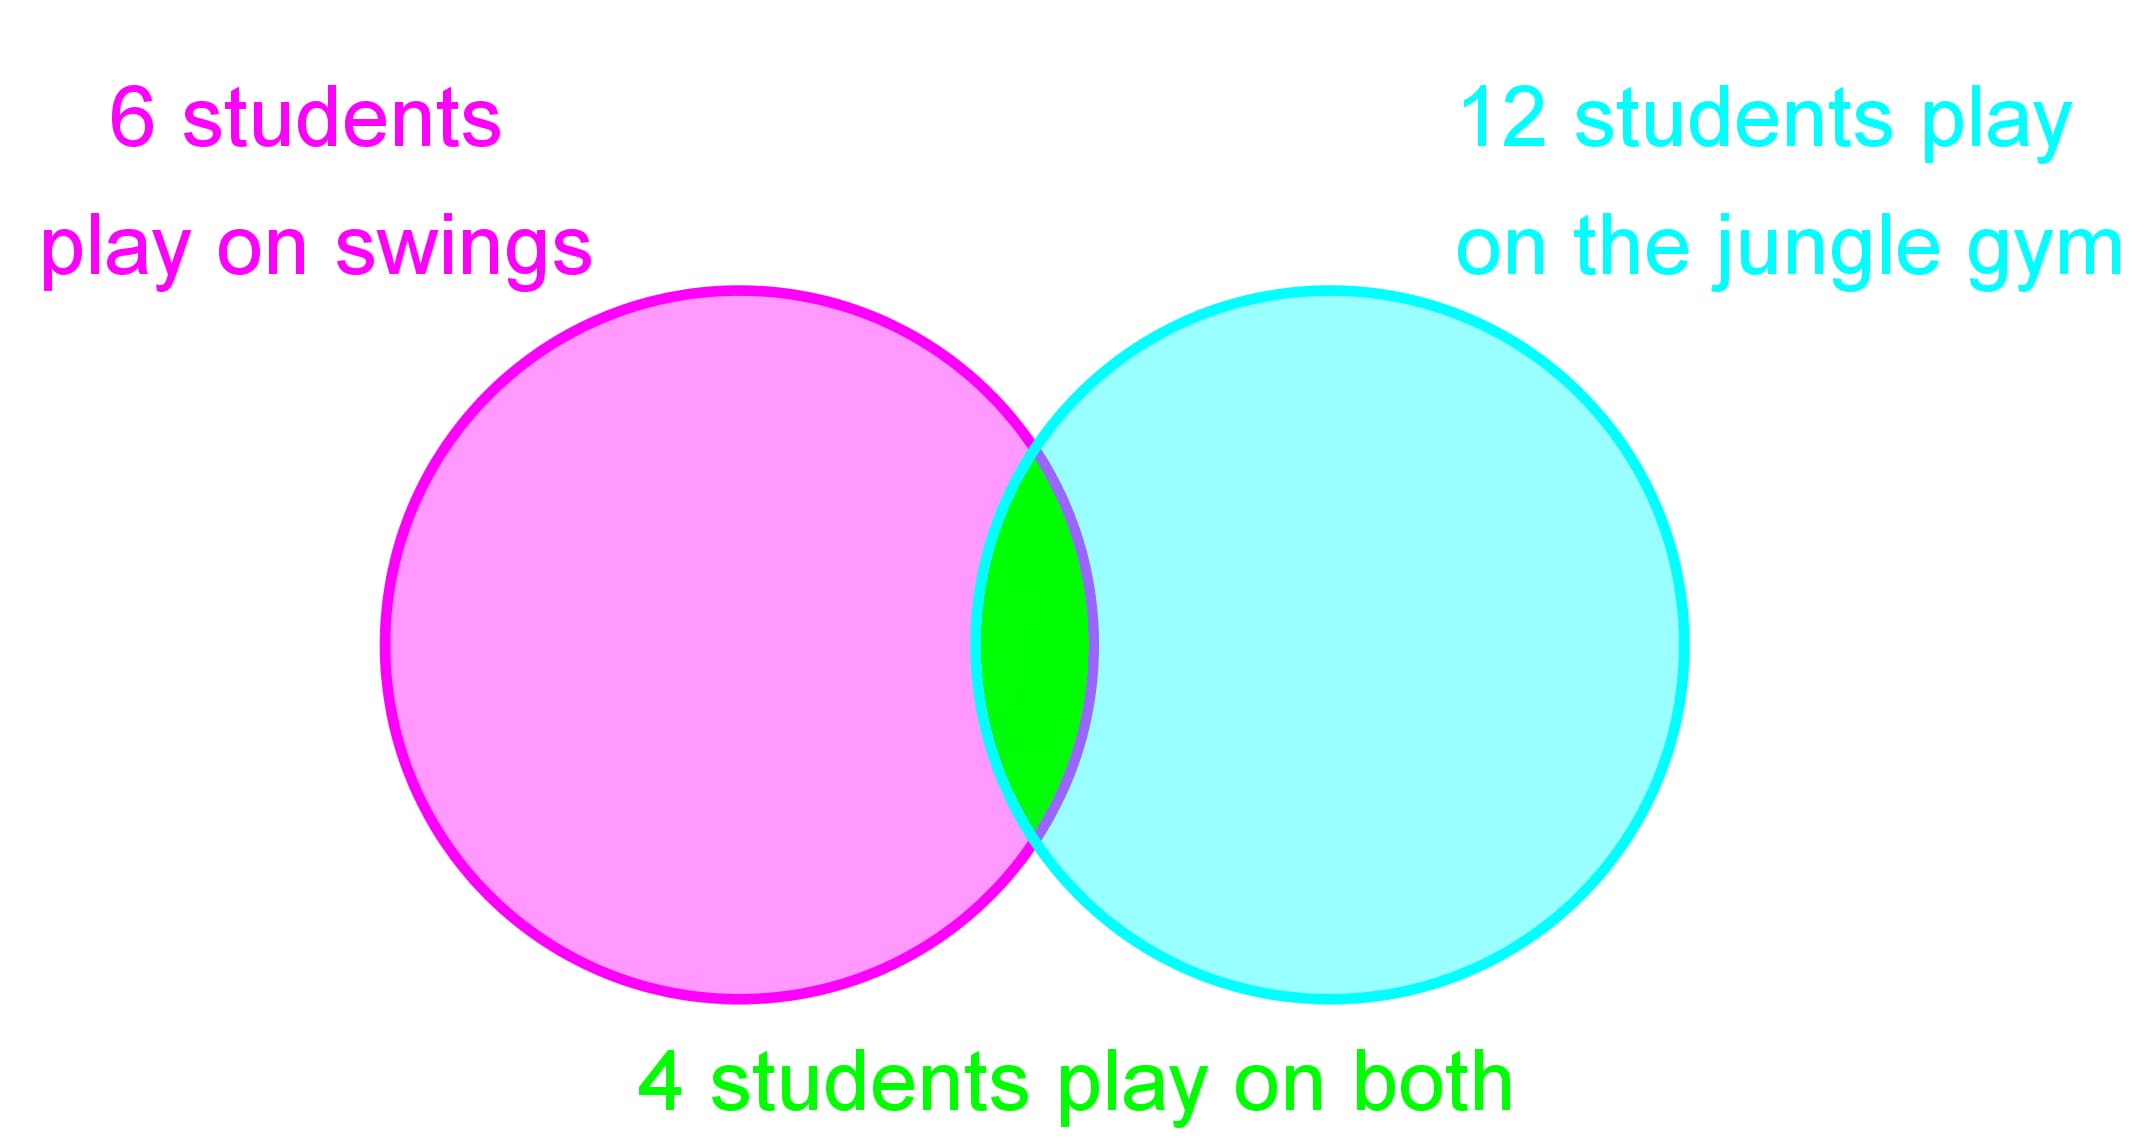
In a playground 6 students like to play on the swings and 12 students like to play on the jungle gym. 4 students played on both.

- Drawing Venn Diagrams
Alex baked a batch of muffins. The different types of toppings Alex put on her muffins are given by the following frequency table.
Different Types of Toppings
# muffins topped
Vanilla Sprinkles
20
M&M's
15
Vanilla Sprinkles and M&M's
10
Represent this data using a Venn Diagram. - Out of a class of 20 students, 12 students play soccer and 8 students play baseball. There are 3 students who play both soccer and baseball.
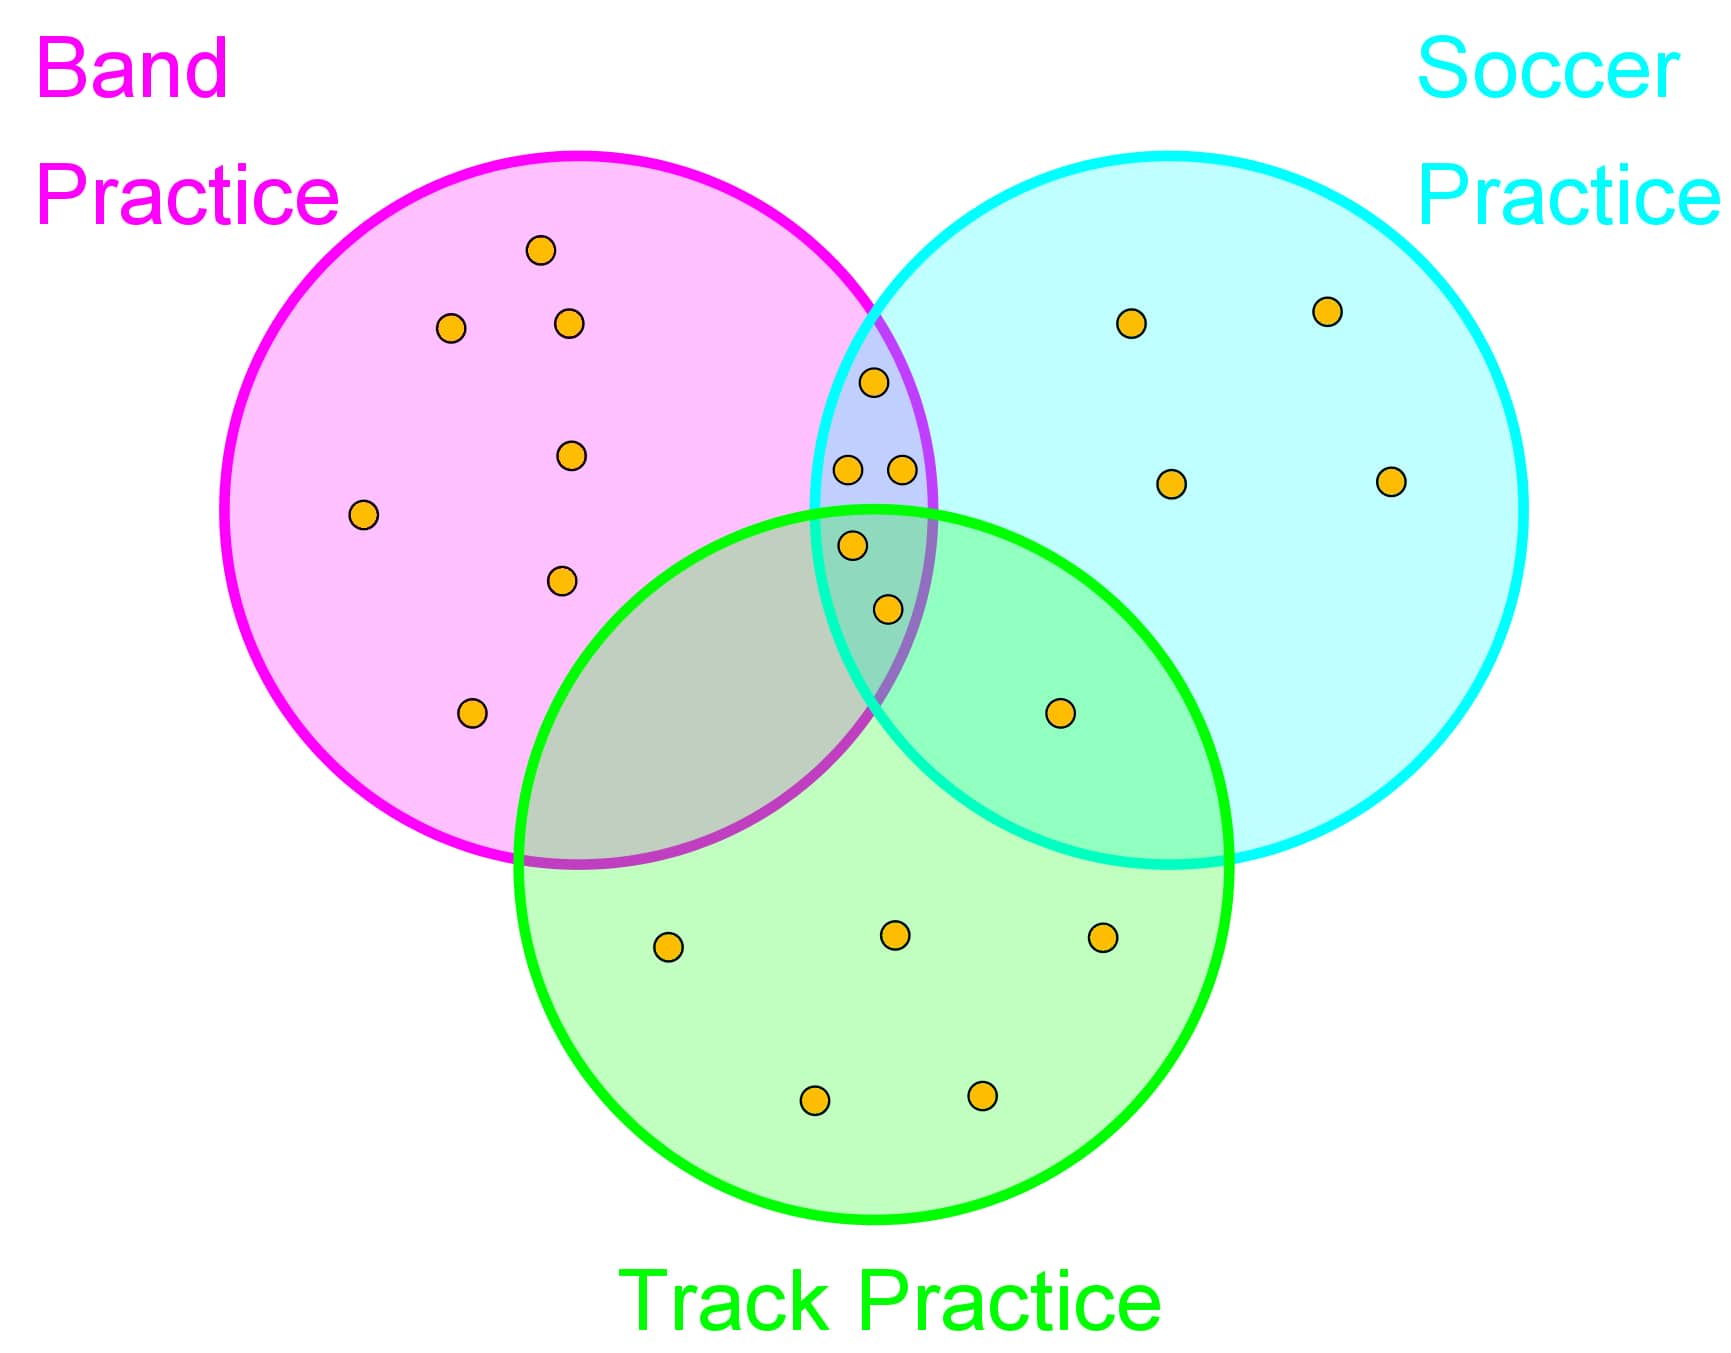
- Interpreting a Venn Diagram with 3 circles
The following dots represent students who attend each after school activity:


