Reading linear relation graphs

0/8
Examples
Lessons
  1. The table below shows the relation of working time and the amount of money that John earns.

    Time, t (hour)

    1

    2

    3

    4

    5

    6

    Amount of money, m (dollar)

    10.5

    21

    31.5

    42

    52.5

    63

    1. Plot the data above on a graph.
    2. From the graph, how much money can John earn after working for 3.5 hours?
    3. From the graph, how long does John need to work in order to make 50 dollars?
  2. The table below shows the distance of a scuba diver diving underwater in relation to time.

    Time, t (minute)

    10

    15

    20

    25

    30

    35

    Distance from water surface, f (feet)

    - 15

    - 22.5

    - 30

    - 37.5

    - 45

    - 52.5

    1. Plot the data above on a graph.
    2. From the graph, what is the distance of the diver from water surface after diving for 40 minutes?
    3. From the graph, what is the time when the diver is - 35 feet from water surface?
  3. An online clothing company can earn $4 for every t-shirt they sell.
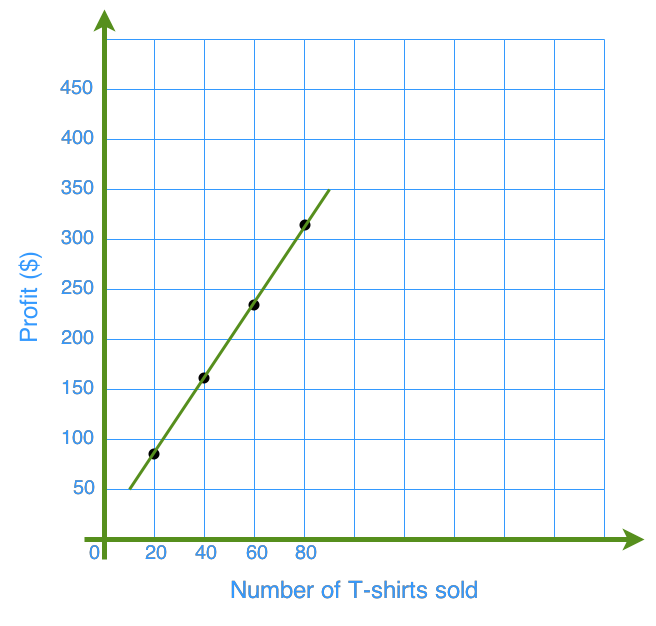
    Reading linear relation graphs
    1. How much can the company earn by selling 55 t-shirts?
    2. How many t-shirts does the company need to sell so that they would earn $200?