Reading and drawing histograms
0/2
Intros
Lessons
0/10
Examples
Lessons
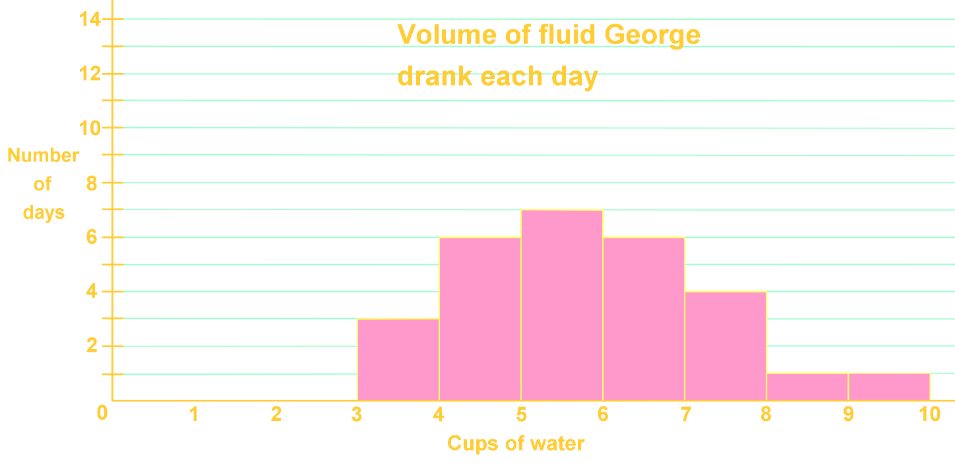
- The histogram shows the volume of fluid George drank each day.

- The frequency table below shows the amount of time spent outdoors each day on average for students in a kindergarten class.
Minutes spent outdoor
Number of days
1-9
4
10-19
5
20-29
3
30-39
2
40-49
1
50-59
2
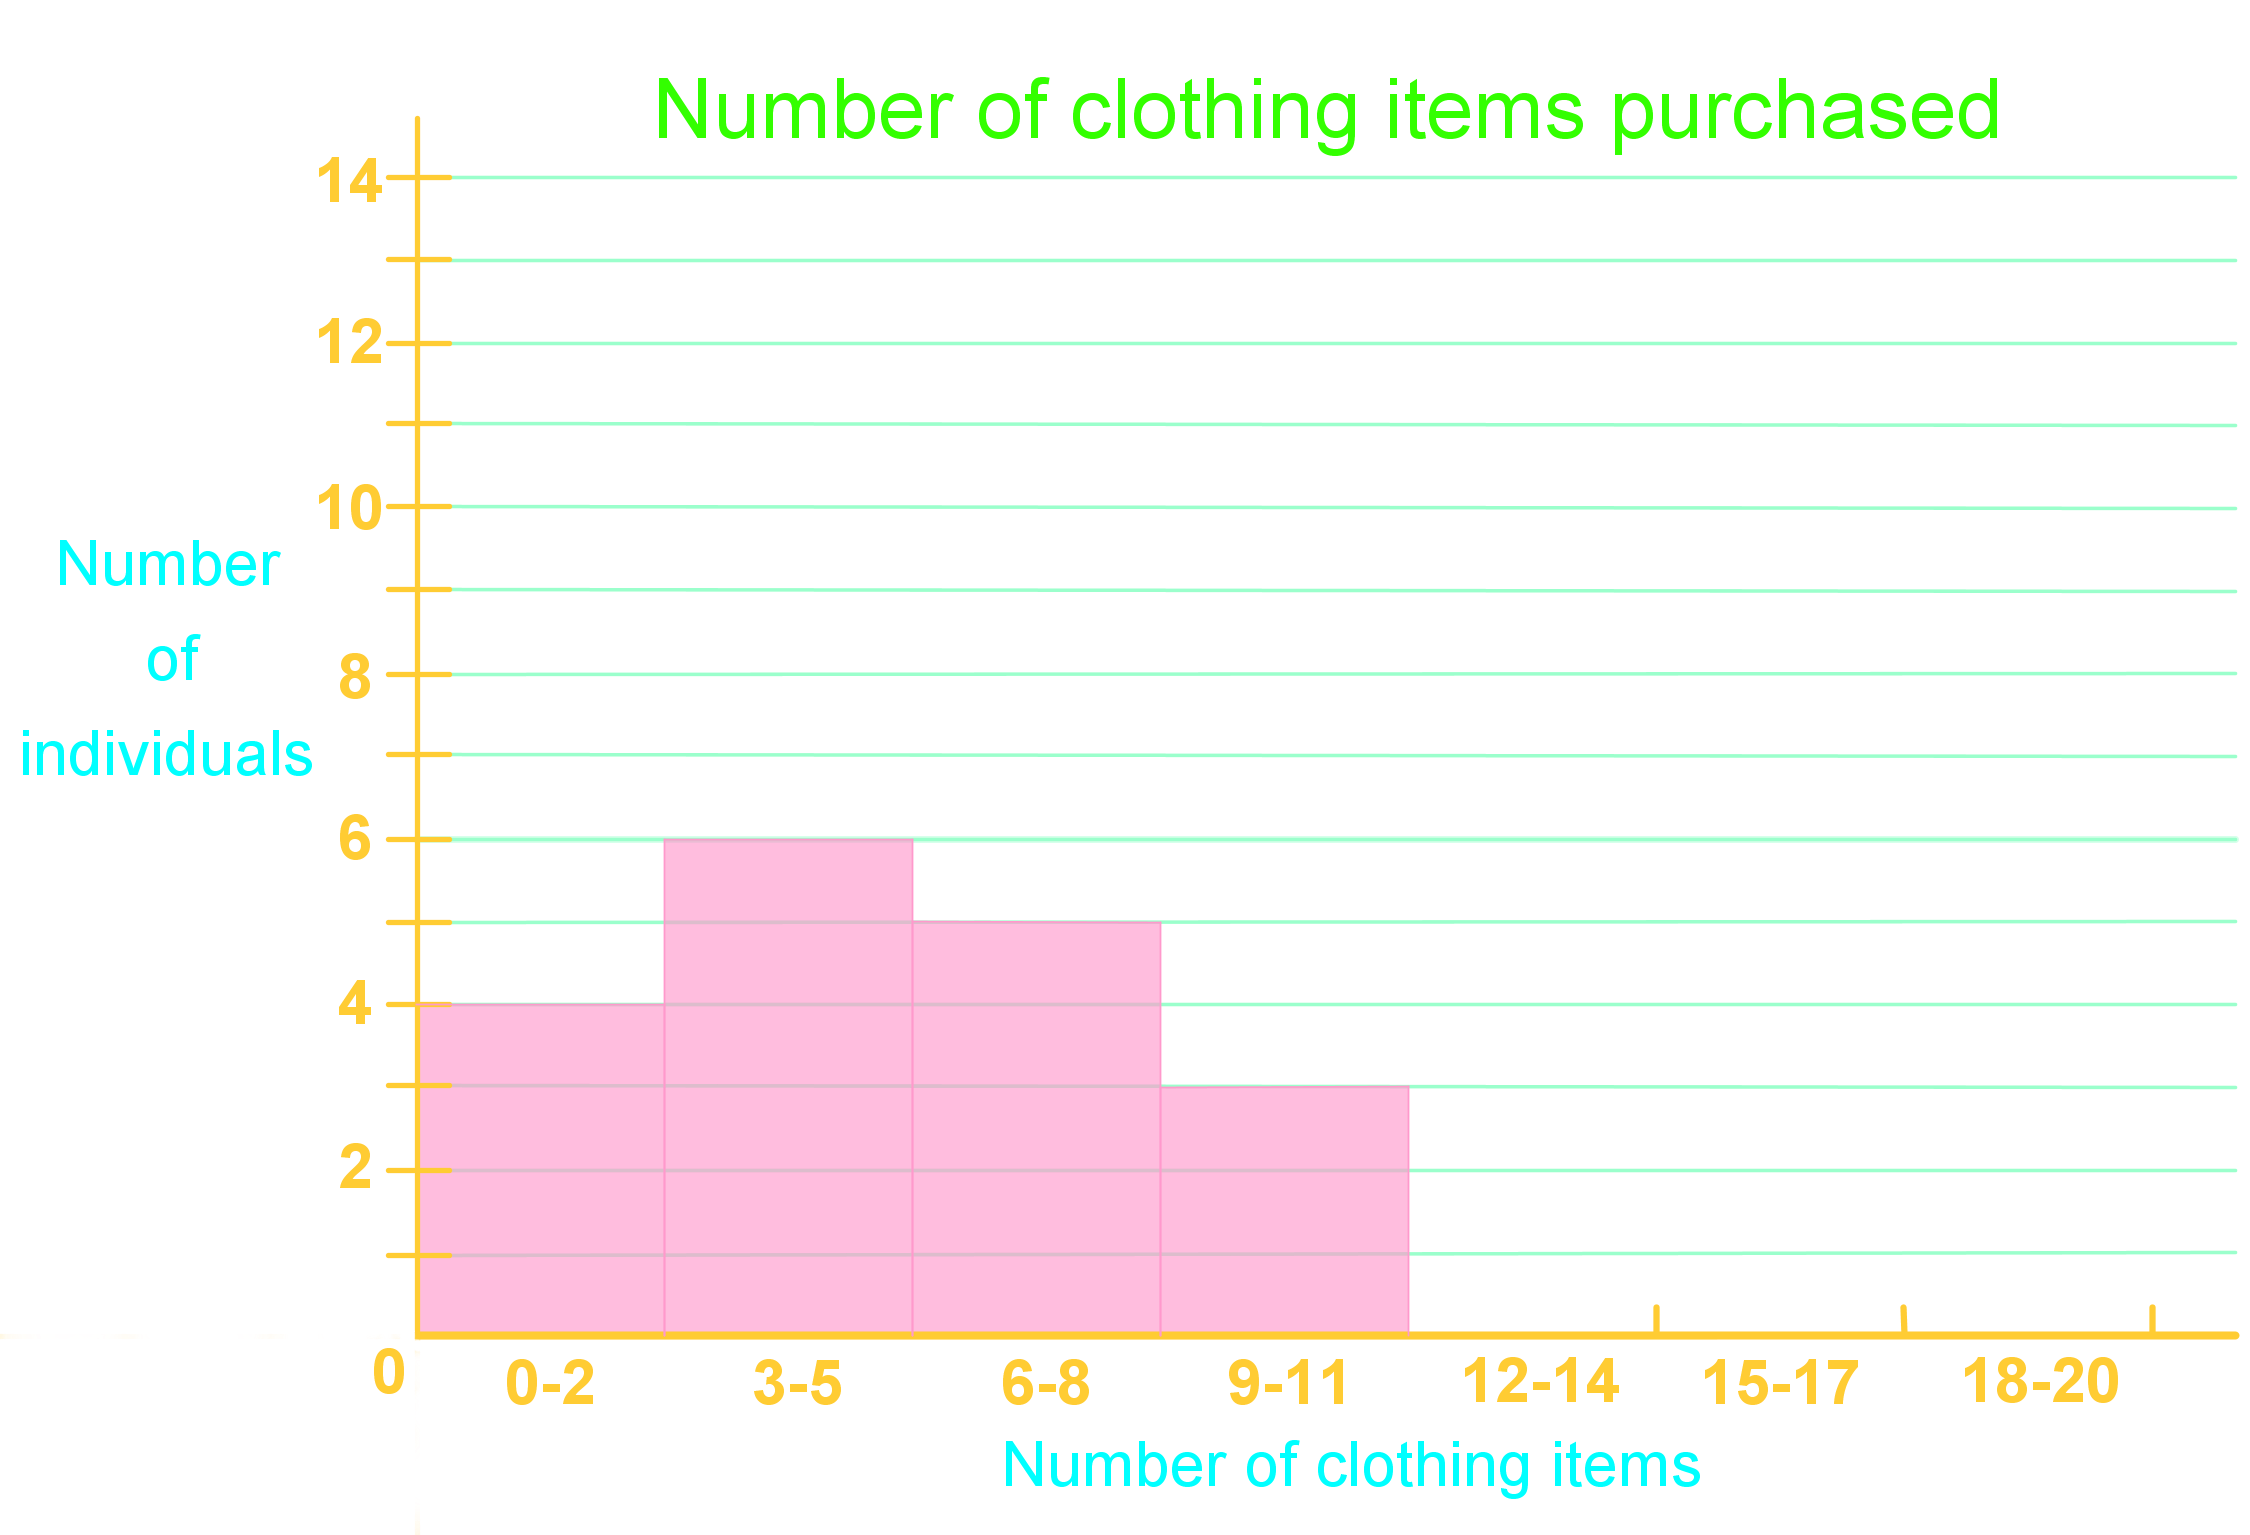
- A survey was done to look at the number of clothing items people purchased in the last 3 years. Below is the data collected:
9, 4, 18, 3, 8, 1, 0, 5, 16, 10, 7, 8, 2, 12, 7, 11, 3, 5, 4, 13, 20, 6, 13, 1


