TOPIC
Organizing data using Venn diagramsMY PROGRESS
Pug Score
0%
Getting Started
"Let's build your foundation!"
Best Streak
0 in a row
Study Points
+0
Overview
Practice
Watch
Read
Quiz
Next Steps
Get Started
Get unlimited access to all videos, practice problems, and study tools.
Back to Menu
Topic Progress
Pug Score
0%
Getting Started
"Let's build your foundation!"
Videos Watched
0/0
Best Practice
No score
Read
Not viewed
Best Quiz
No attempts
Best Streak
0 in a row
Study Points
+0
Overview
Practice
Watch
Read
Quiz
Next Steps
Read
Organizing Data with Venn Diagrams: A Comprehensive Guide
In this lesson, we will learn:
- How to describe common characteristics/attributes in groups of objects
- What the regions of the Venn Diagram mean in order to sort objects by their attributes
- The vocabulary "AND", "OR", and "NOT" within the context of Venn Diagrams
Notes:
- Venn Diagrams organize data by sorting by characteristics ("attributes")
- Circles are used to group objects by these characteristics
- Objects inside the circle have the attribute
- Objects outside the circle do NOT have the attribute
- Objects with more than 1 attribute go into the overlapping part of attribute circles they belong to
- A large rectangle surrounds all circles and objects, it represents all the objects
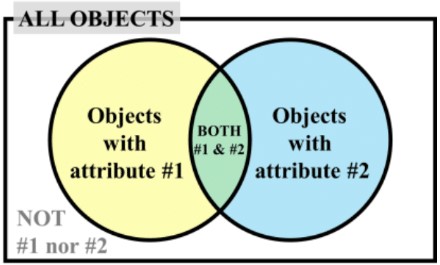
- Alphabet letters are given to objects to save space when sorting in the Venn diagram
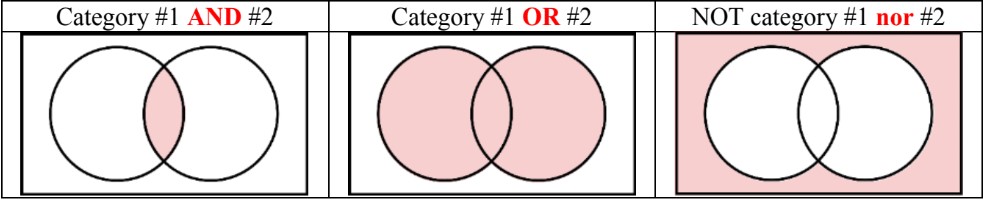
- The vocabulary words "AND", "OR", and "NOT" have special meanings for sorting:
- AND = means must have both attributes
- OR = means having either attribute
- NOT = means not including
Introduction to Organizing Data with Venn Diagrams
Organizing data with Venn diagrams are powerful tools for organizing and visualizing data, particularly when comparing attributes across different groups. Our lesson begins with an essential introduction video that lays the foundation for understanding this concept. By watching this video, you'll gain crucial insights into how Venn diagrams work and their practical applications. The main objectives of this lesson are threefold: First, you'll learn to describe common characteristics shared by different groups. Second, you'll develop a deep understanding of the various regions within Venn diagrams and what they represent. Finally, you'll acquire key vocabulary related to Venn diagrams, enhancing your ability to discuss and analyze data using this method. These skills are invaluable for organizing data, identifying relationships between sets, and making informed decisions based on data analysis. As we progress through the lesson, you'll discover how Venn diagrams can simplify complex data relationships and provide clear visual representations of overlapping attributes.
Understanding Attributes and Grouping
Attributes are essential characteristics or properties that define and distinguish objects or entities. They play a crucial role in organizing and categorizing information, allowing us to group similar items together based on shared features. Understanding attributes is fundamental in data organization, pattern recognition, and effective decision-making across various fields.
In everyday life, we encounter numerous examples of attributes. For instance, when considering food items, we can identify attributes such as color, taste, texture, and nutritional value. A ripe banana possesses attributes like yellow color, sweet taste, and soft texture. Similarly, an apple might have attributes such as red or green color, crisp texture, and a sweet-tart flavor. These attributes help us categorize and differentiate between various fruits and food items.
Numbers also have distinct attributes that allow us to group them. For example, we can categorize numbers based on attributes like even or odd, prime or composite, positive or negative, and integer or decimal. The number 7 has attributes such as being odd, prime, and positive. In contrast, the number 10 has attributes of being even, composite, and positive. These attributes enable us to organize numbers into meaningful groups for mathematical operations and analysis.
Shapes provide another excellent example of how attributes can be used for grouping. We can classify shapes based on attributes like the number of sides, angles, symmetry, and dimensionality. A triangle has attributes of having three sides and three angles, while a square has four equal sides and four right angles. These attributes allow us to distinguish between different geometric figures and group them into categories such as polygons, circles, or three-dimensional shapes.
It's important to note that objects can share multiple attributes, creating overlapping categories. For instance, a red apple and a red ball share the attribute of color but differ in other characteristics. This multi-attribute nature of objects allows for flexible and nuanced grouping systems, depending on the context and purpose of classification.
Importance of Identifying Common Characteristics in Data Organization
Recognizing and utilizing common characteristics or attributes is crucial in effective data organization. By identifying shared attributes, we can create meaningful categories and hierarchies that facilitate efficient information retrieval, analysis, and decision-making. This process is fundamental in various fields, including:
- Database Management: Attributes form the basis of database schema design, allowing for structured storage and querying of information.
- Machine Learning: Identifying relevant attributes is essential for feature selection and engineering in predictive modeling.
- Information Architecture: Grouping content based on common attributes helps create intuitive navigation systems for websites and applications.
- Scientific Classification: Taxonomies in biology and other sciences rely on shared attributes to categorize species and phenomena.
- Market Segmentation: Businesses use customer attributes to group consumers and tailor marketing strategies.
By understanding and leveraging attributes, we can bring order to complex datasets, uncover patterns, and derive meaningful insights. Whether in scientific research, business analytics, or everyday problem-solving, the ability to identify and utilize attributes for grouping objects is a valuable skill that enhances our capacity to process and make sense of the world around us.
Structure of Venn Diagrams
Venn diagrams are powerful visual tools used to represent relationships between sets of objects or concepts. The basic structure of a Venn diagram consists of several key elements: circles, overlapping regions, and a surrounding rectangle. Each of these components plays a crucial role in effectively conveying information and sorting objects into distinct categories.
At the heart of a Venn diagram are the circles. These circles represent different sets or categories. In a typical two-set Venn diagram, you'll see two intersecting circles, while more complex diagrams may include three or more circles. Each circle encompasses all the objects or elements that belong to its particular set.
The overlapping regions are where the magic happens in a Venn diagram. These areas, created where two or more circles intersect, represent elements that belong to multiple sets simultaneously. For instance, in a diagram comparing fruits and vegetables, the overlapping region might contain items like tomatoes, which are botanically fruits but often used as vegetables in cooking.
Surrounding all the circles is a rectangle, which represents the universal set or the total population being considered. This rectangle contains all possible elements relevant to the diagram's context, including those that may not fit into any of the specific circles.
To better understand how objects are sorted into these regions, let's consider the grocery store analogy from the video. Imagine a Venn diagram where one circle represents "Fruits" and another represents "Items on Sale." The overlapping region would contain fruits that are currently on sale. Apples on discount would be placed in this intersection, while full-price bananas would be in the "Fruits" circle but outside the overlap. The surrounding rectangle would represent all items in the grocery store.
Sorting objects into the appropriate regions of a Venn diagram is a process of logical categorization. Each item is evaluated against the criteria of each set (circle) and placed accordingly. Items meeting multiple criteria end up in the overlapping sections, while those meeting none might remain in the rectangle but outside any circle.
Using Letters for Efficient Representation
As Venn diagrams become more complex or need to represent numerous objects, using letters to represent items can greatly enhance efficiency and clarity. Instead of writing out full names or drawing pictures, each object can be assigned a letter. For example, in our grocery store Venn diagram:
- A might represent apples
- B for bananas
- C for carrots
- D for discounted items
This labeling system allows for quick reference and easy manipulation of the diagram. It's particularly useful when dealing with abstract concepts or large datasets. When using letters, it's important to provide a key or legend explaining what each letter represents to ensure clarity for anyone viewing the diagram.
The use of letters also facilitates more complex analysis. For instance, in set theory, these letters can be used in mathematical notations to describe relationships between sets, such as unions, intersections, and complements.
In conclusion, the structure of Venn diagrams, with its circles, overlapping regions, and surrounding rectangle, provides a versatile framework for visualizing and analyzing relationships between sets. Whether used for simple comparisons or complex logical operations, understanding this structure and employing efficient labeling techniques like using letters can significantly enhance one's ability to create and interpret these valuable diagrams.
Interpreting Venn Diagrams
Venn diagrams are powerful visual tools used to represent relationships between sets of data. Interpreting these diagrams correctly is crucial for understanding complex information and making informed decisions. In this section, we'll explore how to extract meaningful insights from Venn diagrams, focusing on the significance of overlapping areas and objects belonging to multiple categories.
At its core, a Venn diagram consists of overlapping circles or other shapes, each representing a distinct category or set. The areas where these shapes intersect indicate shared characteristics or elements common to multiple sets. Understanding these intersections is key to grasping the full picture presented by the diagram.
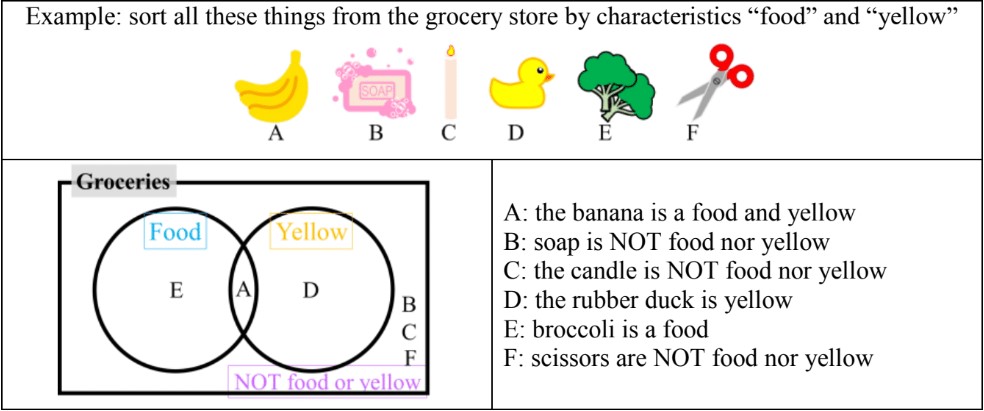
Let's consider a simple example to illustrate this concept. Imagine a Venn diagram with two circles: one representing "Food" and another representing "Yellow" items. The area where these circles overlap would contain items that are both food and yellow, such as bananas or corn. This intersection demonstrates how objects can belong to multiple categories simultaneously, a fundamental principle in data analysis and set theory.
When interpreting Venn diagrams, it's essential to pay attention to all regions, including those outside the circles. Elements in these areas belong to neither of the represented sets, which can be just as informative as the overlapping sections. For instance, in our food and yellow example, items like apples or blueberries would fall outside both circles, being neither yellow nor fitting the specific food category we're focusing on.
As we move to more complex Venn diagrams with three or more sets, the number of possible intersections increases, allowing for more nuanced analysis. For example, a third circle representing "Sweet" items could be added to our previous diagram. This would create new intersections, such as items that are food and sweet but not yellow (like strawberries), or items that are yellow and sweet but not considered food (like certain flowers).
Understanding these relationships is particularly important in data analysis. Venn diagrams help analysts visualize complex datasets, identify patterns, and uncover insights that might not be immediately apparent from raw data alone. They're especially useful for comparing and contrasting different groups, highlighting similarities and differences, and identifying unique characteristics of each set.
Importance in Data Analysis
The ability to interpret Venn diagrams accurately is a valuable skill in data analysis for several reasons:
- Identifying Commonalities: Venn diagrams quickly reveal shared characteristics across different datasets, helping analysts find common ground or overlapping interests.
- Highlighting Uniqueness: By clearly showing which elements belong exclusively to one set, Venn diagrams make it easy to identify unique features or outliers in data.
- Simplifying Complex Relationships: Even with large, complex datasets, Venn diagrams can provide a clear, visual representation of how different categories relate to each other.
- Facilitating Decision Making: By clearly showing the distribution of elements across categories, Venn diagrams can aid in prioritizing actions or allocating resources effectively.
To effectively use Venn diagrams in data analysis, it's crucial to approach them systematically. Start by identifying the main sets or categories represented. Then, examine each intersection, noting the characteristics shared by elements in these overlapping areas. Pay attention to the size of each region, as this can indicate the prevalence of certain combinations of attributes within your dataset.
Remember that Venn diagrams are not just about the presence or absence of elements in certain categories. The relative sizes of different regions can provide valuable insights into the distribution and prevalence of various characteristics within your dataset. This proportional representation in Venn diagrams can be particularly useful when dealing with large volumes of data, offering a quick visual summary of key relationships and trends.
In conclusion, mastering the interpretation of Venn diagrams is an essential skill for anyone working with data or complex sets of information. By understanding how to read these diagrams, including the significance of overlapping areas and objects belonging to multiple categories, analysts can unlock powerful insights and make more informed decisions. Whether you're conducting market research, analyzing scientific data, or exploring demographic trends, the ability to effectively interpret Venn diagrams will prove invaluable in your quest to uncover relationships between sets of data.
Venn Diagram Vocabulary
Understanding the specific vocabulary used in Venn diagrams is crucial for effective data organization and analysis. The key terms 'AND', 'OR', and 'NOT in Venn diagrams' play a vital role in interpreting and creating these visual representations of data sets. Let's explore each term in detail, using the food and yellow example from the video to illustrate their meanings and applications.
AND
In Venn diagrams, 'AND' represents the intersection of two or more sets. It refers to elements that belong to all the sets being considered. For example, in our food and yellow scenario, 'AND' would represent items that are both food AND yellow. This could include bananas, corn, or lemons. The 'AND' region is visually represented by the overlapping area of the circles in a Venn diagram.
OR
'OR' in Venn diagrams encompasses all elements that belong to at least one of the sets being considered. It's an inclusive term, meaning it includes elements that are in either set or both sets. Using our example, 'OR' would represent items that are either food OR yellow, or both. This would include all food items (regardless of color), all yellow items (whether edible or not), and the overlapping items that are both food and yellow. Visually, 'OR' is represented by the entire area covered by all circles in the Venn diagram.
NOT
The term 'NOT in Venn diagrams' refers to elements that are excluded from a particular set. It's used to represent the complement of a set. In our food and yellow example, 'NOT food' would include all items that are not edible, while 'NOT yellow' would encompass all items that are not yellow in color. Visually, 'NOT' is often represented by the area outside a specific circle in the Venn diagram.
Importance of Venn Diagram Vocabulary
Understanding this vocabulary is essential for several reasons:
- Data Organization: These terms help in categorizing and organizing data efficiently. By using 'AND', 'OR', and 'NOT', we can create clear, logical groupings of information.
- Analysis Clarity: They provide a clear framework for analyzing relationships between different data sets. This clarity is crucial in fields like statistics, logic, and data science.
- Problem Solving: In Venn diagram problem solving scenarios, these terms help in breaking down complex issues into manageable components.
- Communication: They offer a standardized way to communicate about data relationships, ensuring that all parties understand the same concepts.
Mastering this vocabulary enhances one's ability to interpret and create Venn diagrams effectively. It allows for more sophisticated data analysis and helps in making informed decisions based on the relationships between different data sets. Whether in academic research, business analytics, or everyday Venn diagram problem solving, the proper use of 'AND', 'OR', and 'NOT' in Venn diagrams can lead to more accurate insights and better-organized information.
Practical Applications of Venn Diagrams
Venn diagrams, introduced by John Venn in 1880, have become invaluable tools for organizing and analyzing data across various fields. These versatile visual representations offer practical applications in mathematics, science, business, and beyond, serving as powerful aids in problem-solving and decision-making processes.
In mathematics, Venn diagrams are frequently used to illustrate set theory concepts. They help students and professionals visualize relationships between different sets, making it easier to understand complex mathematical principles. For instance, in probability theory, Venn diagrams can represent the likelihood of multiple events occurring simultaneously or independently.
The scientific community widely employs Venn diagrams to analyze and present research findings. In biology, these diagrams are particularly useful for comparing genetic traits or species characteristics. Researchers can easily identify shared and unique attributes among different organisms, facilitating the study of evolutionary relationships and biodiversity. Similarly, in chemistry, Venn diagrams can illustrate the properties of different elements or compounds, helping scientists categorize and understand chemical relationships.
Business professionals leverage Venn diagrams for various purposes, including market analysis, product development, and strategic planning. In marketing, these diagrams can visualize target audience segments, helping companies identify overlapping customer groups and tailor their messaging accordingly. During product development, Venn diagrams can compare features of competing products, highlighting unique selling points and areas for improvement.
One of the most significant applications of Venn diagrams is in problem-solving and decision-making. By breaking down complex issues into smaller, more manageable components, these diagrams enable individuals and teams to identify patterns, relationships, and potential solutions more effectively. For example, when faced with a multifaceted business challenge, managers can use Venn diagrams to map out different aspects of the problem, such as resources, constraints, and objectives. This visual representation helps in identifying areas of overlap and potential synergies, leading to more informed decision-making.
In project management, Venn diagrams can be used to allocate tasks and responsibilities among team members. By visualizing the skills and expertise of each team member, project managers can optimize resource allocation and ensure that all necessary competencies are covered. This application directly relates to the concept of set intersections learned in the video, as it identifies areas where team members' skills overlap or complement each other.
Data analysis is another field where Venn diagrams prove extremely useful. In big data applications, these diagrams can help analysts identify patterns and correlations within large datasets. By representing different data attributes or categories as sets, analysts can quickly spot relationships that might not be apparent in traditional tabular formats. This visual approach to data analysis aligns with the video's emphasis on using Venn diagrams to represent complex relationships in a clear, intuitive manner.
In the realm of logic and critical thinking, Venn diagrams serve as powerful tools for analyzing arguments and identifying logical fallacies. By representing premises and conclusions as sets, individuals can visually assess the validity of arguments and spot inconsistencies or gaps in reasoning. This application directly relates to the concept of logical operations discussed in the video, such as union, intersection, and complement.
Education is another field where Venn diagrams find extensive use. Teachers across various subjects employ these diagrams to help students compare and contrast concepts, characters, or historical events. This visual approach to learning enhances students' understanding of relationships and differences, making complex information more accessible and memorable.
As we've seen, the applications of Venn diagrams extend far beyond their mathematical origins. By providing a clear, visual representation of relationships between sets, these diagrams have become indispensable tools in numerous fields. Whether used for data analysis, problem-solving, or decision-making, Venn diagrams continue to offer valuable insights and facilitate clearer understanding of complex information. As demonstrated in the video, mastering the use of Venn diagrams equips individuals with a powerful skill applicable in both academic and professional settings, enhancing their ability to analyze, organize, and communicate information effectively.
Conclusion
In summary, Venn diagrams are powerful tools for organizing data and visualizing data relationships. The introduction video provided a crucial foundation for understanding these concepts. Key points include the ability to represent overlapping sets, identify commonalities and differences, and simplify complex information. Venn diagrams excel in comparing and contrasting data, making them invaluable across various fields. To truly master this skill, practice is essential. Explore different contexts, from business analytics to scientific research, to broaden your understanding. Challenge yourself to create Venn diagrams for diverse scenarios, enhancing your organizing data abilities. Remember, the applications are vast from decision-making to problem-solving. We encourage you to apply these skills in your own data tasks, whether for academic projects or professional endeavors. By consistently using Venn diagrams, you'll develop a sharper analytical mindset and improve your ability to communicate complex ideas visually. Start organizing your data with Venn diagrams today and experience the clarity they bring to your work!
Introduction to Venn Diagrams: Understanding Attributes
In this guide, we will explore how to organize data using Venn diagrams, focusing on understanding and identifying attributes. Venn diagrams are a powerful tool for visualizing relationships between different sets of data. By the end of this guide, you will be able to sort objects based on their attributes using Venn diagrams.
Step 1: Understanding the Structure of a Venn Diagram
To begin with, let's understand the basic structure of a Venn diagram. A classic Venn diagram consists of two or more overlapping circles, each representing a different set. The entire diagram is often enclosed within a rectangle. The overlapping areas of the circles represent the common elements shared by the sets.
For example, if we have two sets, A and B, the overlapping area between the two circles would represent the elements that are common to both sets A and B. The areas that do not overlap represent elements that are unique to each set.
Step 2: Defining Attributes
Attributes are the characteristics, properties, or categories that we use to sort objects. Synonyms for attributes include characteristics, properties, and categories. These terms are used interchangeably and mean the same thing in the context of Venn diagrams.
When we sort objects using a Venn diagram, we group them based on shared attributes. For instance, if we have a list of objects, we can ask ourselves what common attribute they share. This attribute will be the basis for sorting them into different sets in the Venn diagram.
Step 3: Examples of Attributes
Let's look at some examples to better understand how to identify and use attributes for sorting objects:
Example 1: Consider the list of objects: banana, bread, berries, and butter. One common attribute they share is that they all start with the letter 'B'. Another possible attribute is that they are all types of food items. These attributes can be used to sort these objects into different sets in a Venn diagram.
Example 2: Now, consider the numbers 24, 34, 54, and 84. One common attribute is that they all end in the number 4. Another attribute is that they are all even numbers. These attributes can be used to group these numbers in a Venn diagram.
Example 3: Consider the words car, bar, jar, far, and tar. One common attribute is that they all end in 'AR'. Another attribute is that they are all three-letter words. These attributes can be used to sort these words in a Venn diagram.
Step 4: Grouping by Attributes
When grouping objects by attributes, we look for common characteristics that all objects in a group share. For example, if we have the numbers 1, 3, 5, 7, and 9, we can group them based on the attribute that they are all odd numbers. Another possible attribute is that they are all single-digit numbers.
Similarly, if we have a set of shapes such as a triangle, pentagon, square, and circle, we can group them based on the attribute that they are all 2D shapes. We can also consider other attributes such as whether they are shaded or not, or whether they are polygons (shapes with straight edges) or not.
Step 5: Applying Venn Diagrams
Once we have identified the attributes, we can use Venn diagrams to visually represent the relationships between different sets of objects. Each circle in the Venn diagram represents a set of objects that share a common attribute. The overlapping areas represent objects that share multiple attributes.
For example, if we have two sets of objects, one set representing food items that start with the letter 'B' and another set representing food items that are fruits, the overlapping area would represent food items that are both fruits and start with the letter 'B' (e.g., berries).
Step 6: Practice and Familiarity
To become proficient in using Venn diagrams, it is important to practice identifying attributes and sorting objects based on these attributes. The more you practice, the more familiar you will become with the concept of attributes and how to use them effectively in Venn diagrams.
Try creating your own Venn diagrams with different sets of objects and attributes. Experiment with different combinations and see how the relationships between the sets change based on the attributes you choose.
Conclusion
In conclusion, Venn diagrams are a valuable tool for organizing data and understanding relationships between different sets of objects. By identifying and using attributes, we can sort objects into meaningful groups and visualize their relationships. With practice, you will become more adept at using Venn diagrams to organize data and gain insights into the attributes that define different sets.
FAQs
-
What is the primary purpose of a Venn diagram?
The primary purpose of a Venn diagram is to visually represent relationships between different sets of data. It helps in organizing information, comparing and contrasting attributes, and identifying commonalities and differences between groups. Venn diagrams are particularly useful for illustrating complex relationships in a simple, intuitive manner.
-
How do you interpret overlapping regions in a Venn diagram?
Overlapping regions in a Venn diagram represent elements that belong to multiple sets simultaneously. These areas indicate shared characteristics or common elements between the intersecting sets. For example, in a diagram comparing fruits and yellow items, the overlapping region would contain items that are both fruits and yellow, such as bananas.
-
What does 'AND' mean in the context of Venn diagrams?
In Venn diagrams, 'AND' refers to the intersection of two or more sets. It represents elements that belong to all the sets being considered. For instance, in a diagram with circles for "Food" and "Yellow," the 'AND' region would include items that are both food AND yellow, such as corn or bananas.
-
How can Venn diagrams be applied in business settings?
In business, Venn diagrams can be used for market analysis, product development, and strategic planning. They help visualize target audience segments, compare product features, and identify unique selling points. For example, a company might use a Venn diagram to analyze overlapping customer demographics or to compare their product features with competitors'.
-
Why is it important to understand Venn diagram vocabulary?
Understanding Venn diagram vocabulary (such as 'AND', 'OR', and 'NOT') is crucial for effective data organization and analysis. It provides a clear framework for categorizing information, analyzing relationships between data sets, and communicating complex ideas. This vocabulary enhances problem-solving skills and enables more sophisticated data analysis across various fields, from academic research to business analytics.
Prerequisite Topics
Understanding the foundation of a subject is crucial for mastering more complex concepts. When it comes to organizing data using Venn diagrams, having a solid grasp of probability with Venn diagrams is essential. This prerequisite topic provides the necessary groundwork for effectively utilizing Venn diagrams in data organization and analysis.
Venn diagrams are powerful tools for visualizing relationships between different sets of data. However, to fully harness their potential in organizing information, it's vital to understand the underlying principles of probability and set theory. The study of probability with Venn diagrams introduces students to key concepts such as intersections, unions, and complements, which are fundamental in data organization.
By delving into this prerequisite topic, students gain insight into how Venn diagrams can represent complex relationships between data sets. They learn to interpret overlapping regions, which is crucial when organizing data that belongs to multiple categories simultaneously. This understanding becomes invaluable when dealing with real-world data that often doesn't fit neatly into single, distinct categories.
Moreover, the concept of logical operations in Venn diagrams is particularly relevant to data organization. These operations, such as AND, OR, and NOT, are essential for manipulating and analyzing data sets effectively. Understanding how these operations are visually represented in Venn diagrams allows students to organize and categorize data more efficiently and logically.
The probability aspect of this prerequisite topic also plays a crucial role in data organization. It helps students understand the likelihood of data falling into certain categories or intersections. This probabilistic thinking is invaluable when dealing with large datasets or when making predictions based on organized data.
Furthermore, the skills acquired from studying probability with Venn diagrams extend beyond mere data organization. They provide a foundation for more advanced statistical analysis, data interpretation, and decision-making processes. Students who master this prerequisite topic find themselves better equipped to handle complex data scenarios and to draw meaningful conclusions from organized information.
In conclusion, the importance of understanding probability with Venn diagrams as a prerequisite to organizing data using Venn diagrams cannot be overstated. It equips students with the necessary tools to effectively categorize, analyze, and interpret data relationships. This foundational knowledge not only enhances their ability to organize data but also prepares them for more advanced applications of Venn diagrams in various fields of study and professional environments.