Preferences & indifference curves
Intros
Lessons
- Preferences & Indifference Curves Overview:
- Preference Maps & Indifference Curves
- Graph of a person's preference
- Combination of goods where consumer is indifferent
- A family of indifference curves
- Marginal Rate of Substitution
- Rate of giving up good y for good x
- Slope of the indifference curve
- Steep indifference curve → MRS is high
- Flat indifference curve → MRS is low
- Diminishing marginal rate of substitution
- Degree of Substitutability
- How close are the substitutes?
- Different shapes of indifference curves
- Ordinary Goods
- Perfect Substitutes
- Perfect Complements
Examples
Lessons
- Understanding Indifference Curves & Marginal Rate of Substitution
Consider the following Indifference Curves: - Consider the following Indifference Curves:
- Understanding Ordinary Goods, Perfect Substitutes, & Perfect Complements
Draw indifference curves for left shoes and right shoes. - Draw indifference curves for instant coffee and coffee beans.
- Draw indifference curves for chocolate and vanilla.
Free to Join!
Easily See Your Progress
We track the progress you've made on a topic so you know what you've done. From the course view you can easily see what topics have what and the progress you've made on them. Fill the rings to completely master that section or mouse over the icon to see more details.Make Use of Our Learning Aids
Earn Achievements as You Learn
Make the most of your time as you use StudyPug to help you achieve your goals. Earn fun little badges the more you watch, practice, and use our service.Create and Customize Your Avatar
Play with our fun little avatar builder to create and customize your own avatar on StudyPug. Choose your face, eye colour, hair colour and style, and background. Unlock more options the more you use StudyPug.
Topic Notes
In this section, we will see how we can create a map that shows a person’s preference.
Preference Maps & Indifference Curves
Assume there is good x and good y. Then a person’s preference on the combination of these two goods are sorted into three categories:
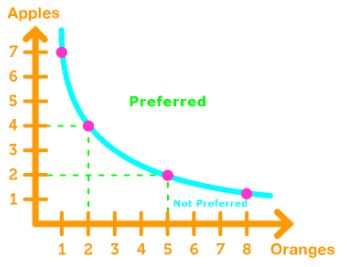
- Preferred
- Indifferent
- Not Preferred
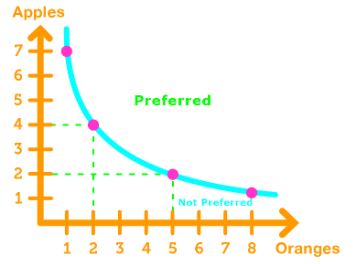
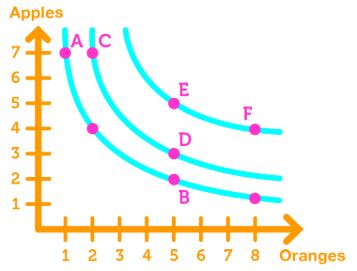
The curve that separates the preferred region from the not preferred region is the indifference curve.
Indifference Curve: a curve that shows a combination of goods in which the consumer sees as equal value.
Note: We can have a family of indifference curves.
Marginal Rate of Substitution
Marginal Rate of Substitution (MRS): the rate which a consumer will give up good y to get an additional unit of good x while remaining indifferent.
The MRS can be found by calculating the tangent slope of the indifference curve at a specific preference.
Note:
- If the indifference curve (or slope) is steep, then the MRS is high. This means the consumer is willing to give up a lot of good y for an additional unit of good x.
- If the indifference curve (or slope) is flat, then the MRS is low. This means the consumer is willing to give up very little good y for an additional unit of good x.
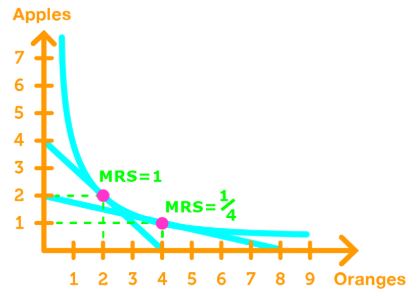
Diminishing Marginal Rate of Substitution: the MRS decreases (tangent slope on the indifference curve becomes flatter) as we increase the quantity of good x.
The less good y a consumer has, the less a consumer is willing to give up good y for good x while remaining indifferent.
Degree of Substitutability
The shape of the indifference curves tells us the degree of substitutability between two goods.
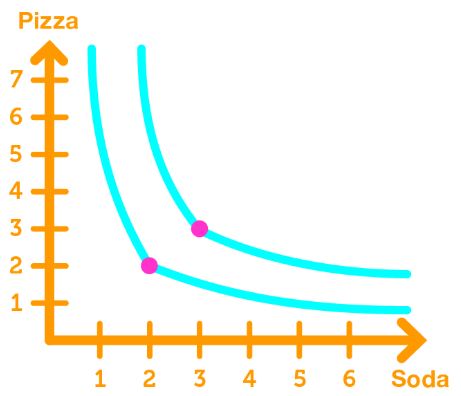
Ordinary goods: the indifference curve is convex.
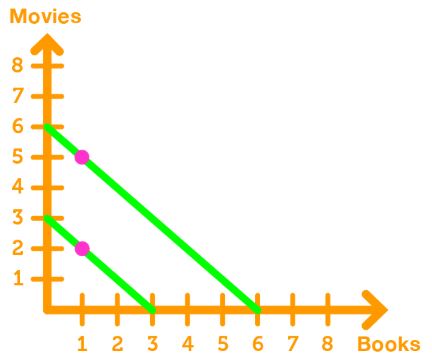
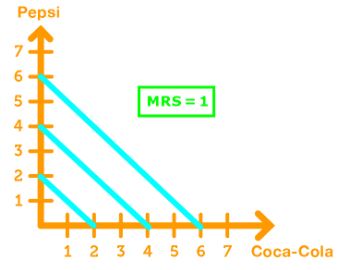
Perfect Substitutes: The indifference curves are lines, with a MRS of 1.
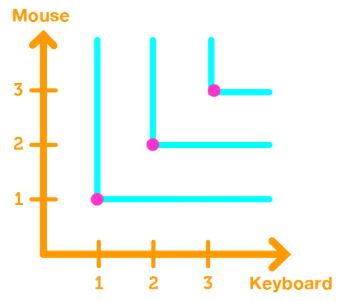
Perfect Complements: The indifference curves are L-shaped
remaining today
remaining today