


Percentages can be an abstract concept when you start learning it. In this section, we will use grids and diagrams to help you understand the concept better.
Representing Percents: From Grids to Real-World Applications Discover effective techniques for representing percents using visual aids and calculations. Master percentage concepts with our comprehensive guide, from basic grids to complex real-world scenarios.
Intros
0/1 watched
Examples
0/6 watched
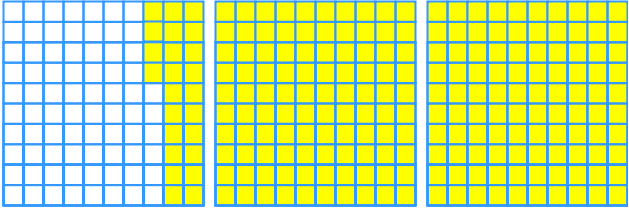
- One fully shaded grid represents 100%. What percent does each of the following diagrams represent?
- Represent the percent by using grids.
Representing percents
Introduction
Welcome to our lesson on representing percents, a fundamental concept in mathematics. We'll begin with an engaging introduction video that sets the stage for understanding percentages. This video is crucial as it provides a visual and relatable context for students to grasp the concept of percents in everyday life. Throughout the lesson, we'll utilize grids and diagrams to transform the abstract notion of percentages into concrete, visual representations. These tools are invaluable in helping students visualize how parts relate to wholes and how percentages can be expressed in various forms. By using these visual aids, we aim to make the concept of percentages more accessible and easier to comprehend. Whether you're dealing with discounts, statistics, or data analysis, a solid understanding of representing percents is essential. So, let's dive in and explore the world of percentages through these interactive and visual methods!
One fully shaded grid represents 100%. What percent does each of the following diagrams represent?
Step 1: Identify the Shaded Region
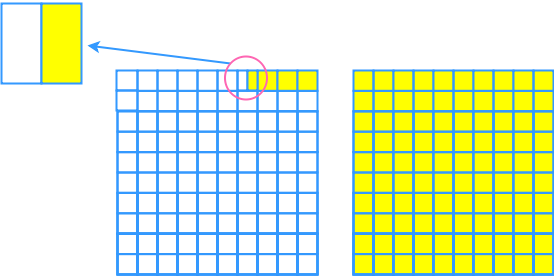
First, we need to identify the shaded region in the given diagram. The shaded region is the area we are interested in calculating the percentage for. In this case, the shaded region is highlighted within one of the squares of the larger grid.
Step 2: Understand the Grid Structure
The larger grid consists of 100 smaller squares. Each of these smaller squares represents 1% of the entire grid. Therefore, the entire grid represents 100%.
Step 3: Determine the Fraction of the Shaded Square
Next, we focus on the specific square that contains the shaded region. This square is further divided into smaller sections. In this example, the square is divided into 5 equal sections, and 2 of these sections are shaded.
Step 4: Calculate the Fraction of the Shaded Area
To find the fraction of the shaded area within the specific square, we take the number of shaded sections (2) and divide it by the total number of sections (5). This gives us a fraction of 2/5 for the shaded area within the square.
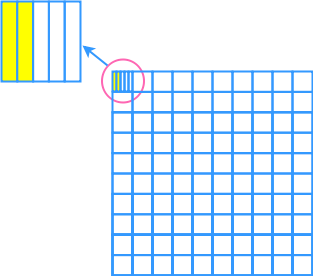
Step 5: Relate the Shaded Area to the Entire Grid
Since the shaded area is within one of the 100 squares of the larger grid, we need to relate this fraction to the entire grid. We do this by multiplying the fraction of the shaded area (2/5) by the fraction of the entire grid that the square represents (1/100).
Step 6: Perform the Multiplication
We multiply the numerators and the denominators of the fractions: (2 * 1) / (5 * 100) = 2 / 500. This gives us a fraction of 2/500 for the shaded area in relation to the entire grid.
Step 7: Simplify the Fraction
We simplify the fraction 2/500 by dividing both the numerator and the denominator by 2. This results in a simplified fraction of 1/250.
Step 8: Convert the Fraction to a Percentage
To convert the fraction 1/250 to a percentage, we multiply it by 100%. This is done by multiplying the numerator by 100 and keeping the denominator the same: (1 * 100) / 250 = 100 / 250.
Step 9: Simplify the Percentage
We simplify the fraction 100/250 by dividing both the numerator and the denominator by 10, resulting in 10/25. Further simplification by dividing both by 5 gives us 2/5.
Step 10: Convert the Fraction to a Decimal
To convert the fraction 2/5 to a decimal, we perform the division 2 ÷ 5, which equals 0.4. Therefore, 2/5 is equivalent to 0.4.
Step 11: Final Percentage
Finally, we add the percent symbol to the decimal to get the final percentage. The shaded area in the diagram represents 0.4% of the entire grid.
Here are some frequently asked questions about representing percents:
1. What is the difference between percent and percentage?
Percent refers to a number out of 100 and is represented by the % symbol. For example, 25% means 25 out of 100. Percentage, on the other hand, is the result of a calculation involving a percent. For instance, if we say "25% of 80 is 20," the 20 is a percentage.
2. How do I convert a percent to a decimal?
To convert a percent to a decimal, simply move the decimal point two places to the left and remove the % symbol. For example, 75% becomes 0.75, and 8% becomes 0.08.
3. Can you explain how to use a 10x10 grid to represent percentages?
A 10x10 grid contains 100 squares, making it ideal for representing percentages. Each square represents 1%. To show a percentage, simply shade the corresponding number of squares. For example, to represent 35%, you would shade 35 squares of the grid.
4. How do I calculate percentage increase or decrease?
To calculate percentage increase or decrease, use this formula: Percentage change = (Change in value / Original value) × 100. For an increase, the change is positive; for a decrease, it's negative. For example, if a price increases from $80 to $100, the percentage increase is: (20 / 80) × 100 = 25%.
5. What are some common real-world applications of percentages?
Percentages are used widely in various fields. In finance, they're used for interest rates and discounts. In statistics, they help represent survey results. In education, they're used for grading. Businesses use percentages for market share analysis and sales reports. Even in daily life, we encounter percentages in nutrition labels, battery life indicators, and weather forecasts.
Understanding the concept of representing percents is crucial in mathematics and real-world applications. To fully grasp this topic, it's essential to have a solid foundation in several prerequisite areas. These fundamental skills will help you navigate the complexities of percentages with confidence and accuracy.
One of the key prerequisites is basic multiplication and division. This skill is fundamental when working with percentages, as you'll often need to convert between fractions, decimals, and percentages. Being proficient in these operations allows you to quickly calculate percentages of quantities and solve percentage-related problems efficiently.
Another important skill is interpreting pie charts. Pie charts are a common visual representation of percentages, and understanding how to read and analyze them is crucial. This skill helps you visualize percentage distributions and make comparisons between different parts of a whole, which is essential when working with real-world data and statistics.
Similarly, interpreting bar graphs is another valuable prerequisite. While not directly related to percentages, the ability to read and understand various types of graphs enhances your overall data interpretation skills. This proficiency allows you to better comprehend percentage-based information presented in different visual formats.
Perhaps the most directly relevant prerequisite is solving percentage word problems. This skill combines numerical calculations with real-world contexts, helping you apply percentage concepts to practical situations. By mastering this skill, you'll be better equipped to tackle complex problems involving percentages in various fields, from finance to science.
Understanding these prerequisite topics provides a strong foundation for representing percents. The ability to perform basic calculations, interpret visual data, and solve word problems creates a comprehensive skill set that enhances your overall mathematical proficiency. As you delve deeper into the world of percentages, you'll find that these foundational skills continually support your learning and problem-solving abilities.
Moreover, these prerequisites are interconnected. For instance, your ability to interpret pie charts and bar graphs often relies on your skill in basic multiplication and division. Similarly, solving percentage word problems frequently involves interpreting visual data and performing calculations. By strengthening each of these areas, you create a synergistic effect that boosts your overall understanding and application of percentage concepts.
In conclusion, mastering these prerequisite topics is not just about preparing for a specific lesson on representing percents. It's about building a robust mathematical toolkit that will serve you well in various academic and real-world scenarios. As you progress in your studies, you'll find that these fundamental skills continue to be relevant and valuable, forming the bedrock of more advanced mathematical concepts.