Organizing Data with Venn Diagrams: A Comprehensive Guide
Discover the power of Venn diagrams in data organization. Learn to visualize complex relationships, identify patterns, and make informed decisions through effective data representation.

  1. Intros0/3 watched
  2. Examples0/9 watched
  3. Practice0% mastered
  1. 0/3
  2. 0/9
  3. 0%
Now Playing:Organizing data using venn diagrams – Example 0a
Intros
0/3 watched
  1. Introduction to Venn Diagrams:
  2. Introduction to Venn Diagrams:
    Understanding attributes
  3. Introduction to Venn Diagrams:
    Sorting objects with Venn diagram circles
Examples
0/9 watched
  1. Recognizing and discriminating attributes of shapes
    Write the letter of the shape(s) that matches the attribute of:

    Organizing Data using Venn Diagrams
    1. triangle

    2. triangle OR striped

    3. triangle AND striped

    4. not a triangle

Practice
0%
Build your skill!Try your hand with these practice questions.
Organizing data using Venn diagrams
Notes

In this lesson, we will learn:

  • How to describe common characteristics/attributes in groups of objects
  • What the regions of the Venn Diagram mean in order to sort objects by their attributes
  • The vocabulary "AND", "OR", and "NOT" within the context of Venn Diagrams

Notes:

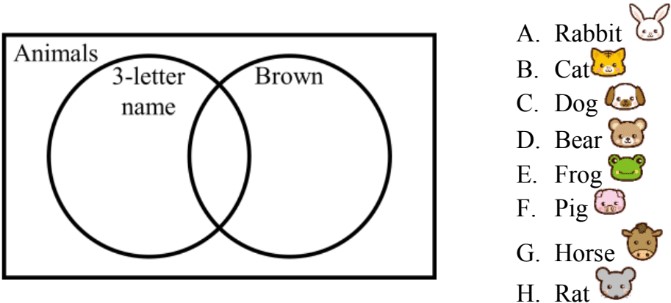
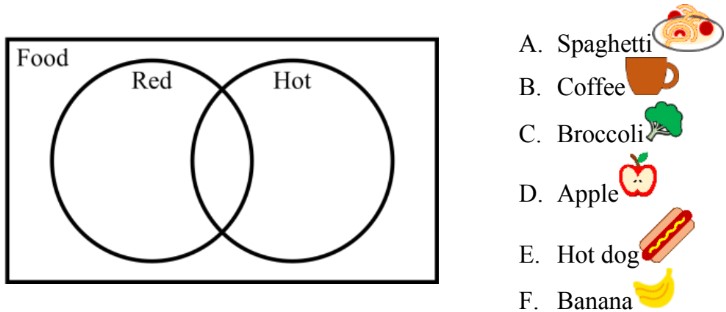
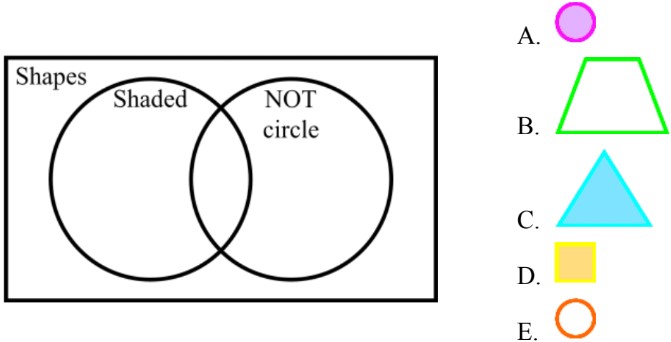
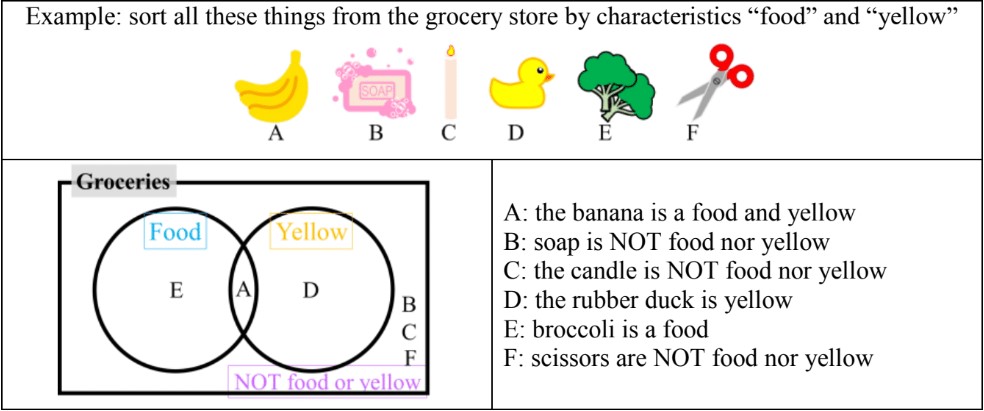
  • Venn Diagrams organize data by sorting by characteristics ("attributes")
    • Circles are used to group objects by these characteristics
      • Objects inside the circle have the attribute
      • Objects outside the circle do NOT have the attribute
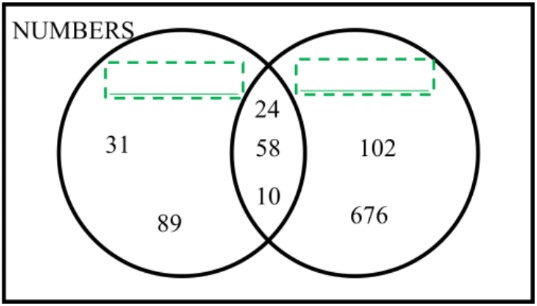
    • Objects with more than 1 attribute go into the overlapping part of attribute circles they belong to
    • A large rectangle surrounds all circles and objects, it represents all the objects
Organizing Data using Venn Diagrams

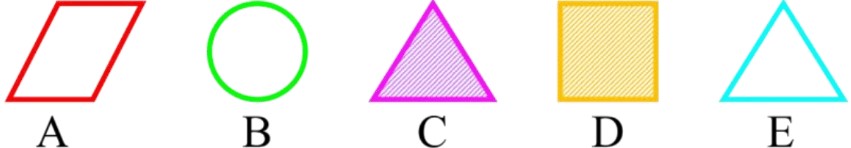
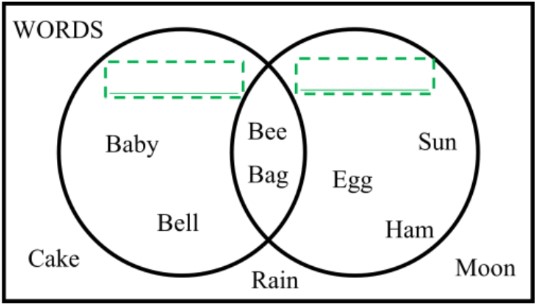
  • Alphabet letters are given to objects to save space when sorting in the Venn diagram
Organizing Data using Venn Diagrams

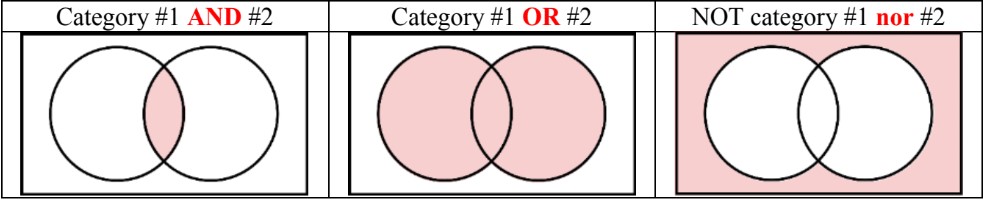
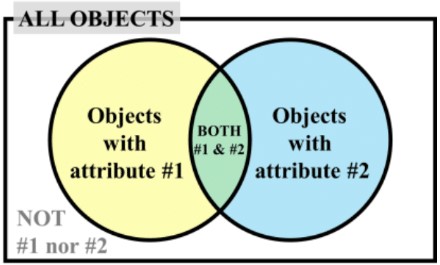
  • The vocabulary words "AND", "OR", and "NOT" have special meanings for sorting:
    • AND = means must have both attributes
    • OR = means having either attribute
    • NOT = means not including
Organizing Data using Venn Diagrams
Concept

Introduction to Organizing Data with Venn Diagrams

Organizing data with Venn diagrams are powerful tools for organizing and visualizing data, particularly when comparing attributes across different groups. Our lesson begins with an essential introduction video that lays the foundation for understanding this concept. By watching this video, you'll gain crucial insights into how Venn diagrams work and their practical applications. The main objectives of this lesson are threefold: First, you'll learn to describe common characteristics shared by different groups. Second, you'll develop a deep understanding of the various regions within Venn diagrams and what they represent. Finally, you'll acquire key vocabulary related to Venn diagrams, enhancing your ability to discuss and analyze data using this method. These skills are invaluable for organizing data, identifying relationships between sets, and making informed decisions based on data analysis. As we progress through the lesson, you'll discover how Venn diagrams can simplify complex data relationships and provide clear visual representations of overlapping attributes.

Example

In this guide, we will explore how to organize data using Venn diagrams, focusing on understanding and identifying attributes. Venn diagrams are a powerful tool for visualizing relationships between different sets of data. By the end of this guide, you will be able to sort objects based on their attributes using Venn diagrams.

Step 1: Understanding the Structure of a Venn Diagram

To begin with, let's understand the basic structure of a Venn diagram. A classic Venn diagram consists of two or more overlapping circles, each representing a different set. The entire diagram is often enclosed within a rectangle. The overlapping areas of the circles represent the common elements shared by the sets.

For example, if we have two sets, A and B, the overlapping area between the two circles would represent the elements that are common to both sets A and B. The areas that do not overlap represent elements that are unique to each set.

Step 2: Defining Attributes

Attributes are the characteristics, properties, or categories that we use to sort objects. Synonyms for attributes include characteristics, properties, and categories. These terms are used interchangeably and mean the same thing in the context of Venn diagrams.

When we sort objects using a Venn diagram, we group them based on shared attributes. For instance, if we have a list of objects, we can ask ourselves what common attribute they share. This attribute will be the basis for sorting them into different sets in the Venn diagram.

Step 3: Examples of Attributes

Let's look at some examples to better understand how to identify and use attributes for sorting objects:

Example 1: Consider the list of objects: banana, bread, berries, and butter. One common attribute they share is that they all start with the letter 'B'. Another possible attribute is that they are all types of food items. These attributes can be used to sort these objects into different sets in a Venn diagram.

Example 2: Now, consider the numbers 24, 34, 54, and 84. One common attribute is that they all end in the number 4. Another attribute is that they are all even numbers. These attributes can be used to group these numbers in a Venn diagram.

Example 3: Consider the words car, bar, jar, far, and tar. One common attribute is that they all end in 'AR'. Another attribute is that they are all three-letter words. These attributes can be used to sort these words in a Venn diagram.

Step 4: Grouping by Attributes

When grouping objects by attributes, we look for common characteristics that all objects in a group share. For example, if we have the numbers 1, 3, 5, 7, and 9, we can group them based on the attribute that they are all odd numbers. Another possible attribute is that they are all single-digit numbers.

Similarly, if we have a set of shapes such as a triangle, pentagon, square, and circle, we can group them based on the attribute that they are all 2D shapes. We can also consider other attributes such as whether they are shaded or not, or whether they are polygons (shapes with straight edges) or not.

Step 5: Applying Venn Diagrams

Once we have identified the attributes, we can use Venn diagrams to visually represent the relationships between different sets of objects. Each circle in the Venn diagram represents a set of objects that share a common attribute. The overlapping areas represent objects that share multiple attributes.

For example, if we have two sets of objects, one set representing food items that start with the letter 'B' and another set representing food items that are fruits, the overlapping area would represent food items that are both fruits and start with the letter 'B' (e.g., berries).

Step 6: Practice and Familiarity

To become proficient in using Venn diagrams, it is important to practice identifying attributes and sorting objects based on these attributes. The more you practice, the more familiar you will become with the concept of attributes and how to use them effectively in Venn diagrams.

Try creating your own Venn diagrams with different sets of objects and attributes. Experiment with different combinations and see how the relationships between the sets change based on the attributes you choose.

Conclusion

In conclusion, Venn diagrams are a valuable tool for organizing data and understanding relationships between different sets of objects. By identifying and using attributes, we can sort objects into meaningful groups and visualize their relationships. With practice, you will become more adept at using Venn diagrams to organize data and gain insights into the attributes that define different sets.

FAQs
  1. What is the primary purpose of a Venn diagram?

    The primary purpose of a Venn diagram is to visually represent relationships between different sets of data. It helps in organizing information, comparing and contrasting attributes, and identifying commonalities and differences between groups. Venn diagrams are particularly useful for illustrating complex relationships in a simple, intuitive manner.

  2. How do you interpret overlapping regions in a Venn diagram?

    Overlapping regions in a Venn diagram represent elements that belong to multiple sets simultaneously. These areas indicate shared characteristics or common elements between the intersecting sets. For example, in a diagram comparing fruits and yellow items, the overlapping region would contain items that are both fruits and yellow, such as bananas.

  3. What does 'AND' mean in the context of Venn diagrams?

    In Venn diagrams, 'AND' refers to the intersection of two or more sets. It represents elements that belong to all the sets being considered. For instance, in a diagram with circles for "Food" and "Yellow," the 'AND' region would include items that are both food AND yellow, such as corn or bananas.

  4. How can Venn diagrams be applied in business settings?

    In business, Venn diagrams can be used for market analysis, product development, and strategic planning. They help visualize target audience segments, compare product features, and identify unique selling points. For example, a company might use a Venn diagram to analyze overlapping customer demographics or to compare their product features with competitors'.

  5. Why is it important to understand Venn diagram vocabulary?

    Understanding Venn diagram vocabulary (such as 'AND', 'OR', and 'NOT') is crucial for effective data organization and analysis. It provides a clear framework for categorizing information, analyzing relationships between data sets, and communicating complex ideas. This vocabulary enhances problem-solving skills and enables more sophisticated data analysis across various fields, from academic research to business analytics.

Prerequisites

Understanding the foundation of a subject is crucial for mastering more complex concepts. When it comes to organizing data using Venn diagrams, having a solid grasp of probability with Venn diagrams is essential. This prerequisite topic provides the necessary groundwork for effectively utilizing Venn diagrams in data organization and analysis.

Venn diagrams are powerful tools for visualizing relationships between different sets of data. However, to fully harness their potential in organizing information, it's vital to understand the underlying principles of probability and set theory. The study of probability with Venn diagrams introduces students to key concepts such as intersections, unions, and complements, which are fundamental in data organization.

By delving into this prerequisite topic, students gain insight into how Venn diagrams can represent complex relationships between data sets. They learn to interpret overlapping regions, which is crucial when organizing data that belongs to multiple categories simultaneously. This understanding becomes invaluable when dealing with real-world data that often doesn't fit neatly into single, distinct categories.

Moreover, the concept of logical operations in Venn diagrams is particularly relevant to data organization. These operations, such as AND, OR, and NOT, are essential for manipulating and analyzing data sets effectively. Understanding how these operations are visually represented in Venn diagrams allows students to organize and categorize data more efficiently and logically.

The probability aspect of this prerequisite topic also plays a crucial role in data organization. It helps students understand the likelihood of data falling into certain categories or intersections. This probabilistic thinking is invaluable when dealing with large datasets or when making predictions based on organized data.

Furthermore, the skills acquired from studying probability with Venn diagrams extend beyond mere data organization. They provide a foundation for more advanced statistical analysis, data interpretation, and decision-making processes. Students who master this prerequisite topic find themselves better equipped to handle complex data scenarios and to draw meaningful conclusions from organized information.

In conclusion, the importance of understanding probability with Venn diagrams as a prerequisite to organizing data using Venn diagrams cannot be overstated. It equips students with the necessary tools to effectively categorize, analyze, and interpret data relationships. This foundational knowledge not only enhances their ability to organize data but also prepares them for more advanced applications of Venn diagrams in various fields of study and professional environments.