TOPIC
Introduction to mean, median, mode, and rangeMY PROGRESS
Pug Score
0%
Getting Started
"Let's build your foundation!"
Best Streak
0 in a row
Study Points
+0
Overview
Practice
Watch
Read
Quiz
Next Steps
Get Started
Get unlimited access to all videos, practice problems, and study tools.
Back to Menu
Topic Progress
Pug Score
0%
Getting Started
"Let's build your foundation!"
Videos Watched
0/0
Best Practice
No score
Read
Not viewed
Best Quiz
No attempts
Best Streak
0 in a row
Study Points
+0
Overview
Practice
Watch
Read
Quiz
Next Steps
Read
Mastering Mean, Median, Mode, and Range: Key to Data Analysis
In this lesson, we will learn:
- How to calculate the four types of measures of central tendency for a data set: mean, median, mode, and range
Notes:
- Measures of central tendency refer to types of calculations done with data set numbers. A single number will describe the most common (central; middle) behaviors of the information you have collected.
- When doing experiments or surveys, the steps are to:
- (1) gather data
- (2) organize data
- (3) analyze data
- Analyzing data means that we want to make sense of all the information that we've gathered. What does the data tell us? What can we learn from it?
- There are four measures of central tendency: mean, median, mode and range.
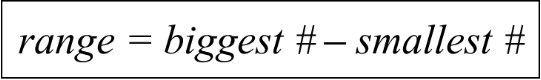
- Range is the difference between the highest and lowest number
- It represents how far the data set is spread (how much it varies)
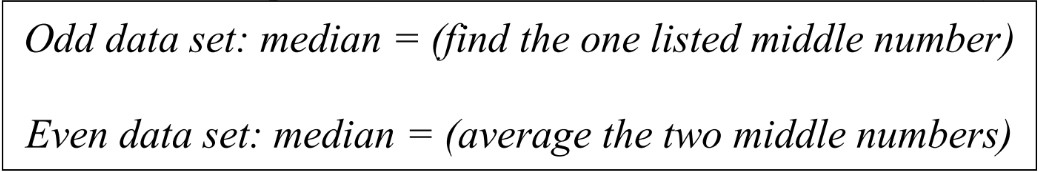
- Median is the number listed in the middle of the data set (in order)
- A quick way to find the approximate center of the data
- To find the median, first list all numbers from least to greatest. Then count the number of data points (is there a total number that is odd or even?)
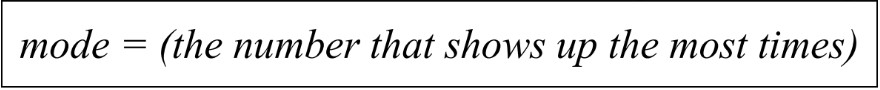
- Mode is the most common data value; the one that shows up the most frequently
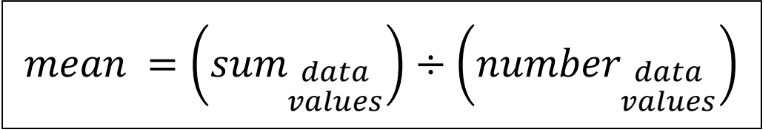
- Mean (also called average) is the sum of all data points divided by the number of data points
- This is a better way to find the true middle of the data set; it spreads all the values across all data points, giving a better idea of what is happening overall
Introduction to Mean, Median, Mode, and Range
Welcome to our exploration of mean, median, mode, and range - fundamental concepts in data analysis. As introduced in our video, these measures of central tendency are essential tools for understanding and interpreting data sets. The mean represents the average of all values, while the median is the middle value when data is ordered. The mode identifies the most frequent value, and the range shows the spread between the highest and lowest values. Mastering these concepts is crucial for anyone delving into mathematics, statistics, or data science. They provide valuable insights into data distribution and help in making informed decisions based on numerical information. Whether you're a student, researcher, or professional, understanding these measures will enhance your ability to analyze and interpret data effectively, forming the foundation for more advanced statistical techniques.
Understanding Data Sets and Measures of Central Tendency
Data sets are collections of information gathered for a specific purpose or study. They form the foundation of statistical analysis and play a crucial role in various fields, from scientific research to business decision-making. To illustrate this concept, let's consider an example of collecting height data from friends or classmates.
Imagine you're curious about the average height of students in your class. This curiosity leads you to embark on a data collection journey. The process typically involves three main steps: gathering data, organizing data, and analyzing data.
In the data gathering phase, you would approach each classmate and record their height. This raw information forms your data set. As you collect more heights, you'll soon have a substantial amount of numbers. However, looking at a long list of heights doesn't immediately give you a clear picture of the overall trend.
This is where organizing data comes into play. You might decide to create a table or a chart to arrange the heights in a more structured manner. Perhaps you group the heights into ranges or create a frequency distribution. This step helps in visualizing the data and spotting patterns that weren't apparent in the raw list.
The final step is data analysis, where measures of central tendency become invaluable. These measures help summarize large data sets into single, representative values. The three primary measures of central tendency are the mean (average), median (middle value), and mode (most frequent value).
For your height data, calculating the mean would give you the average height of your classmates. The median would show the middle height when all values are arranged in order. The mode would reveal the most common height in your class. Each of these measures provides a different perspective on the "center" of your data set.
But why are these measures so important? Imagine trying to describe the heights of 100 classmates by listing each individual height. It would be time-consuming and difficult for others to grasp the overall picture. Measures of central tendency condense this information into easily understandable values.
These measures help in making sense of large data sets by providing a single value that represents the entire group. They allow for quick comparisons between different data sets. For instance, you could easily compare the average height of your class with another class or with national averages.
Moreover, measures of central tendency are crucial for drawing meaningful conclusions from data. They help identify trends, make predictions, and support decision-making processes. In our height example, these measures could help determine if the class is generally taller or shorter than average, which might be useful for various purposes, from designing classroom furniture to planning physical education activities.
It's important to note that while measures of central tendency are powerful tools, they should be used in conjunction with other statistical measures for a comprehensive analysis. Measures of spread, such as range and standard deviation, complement central tendency measures by providing information about how data points are distributed around the center.
In conclusion, data sets are the raw material of statistical analysis, and measures of central tendency are the tools that help us extract meaningful insights from this raw data. By following the steps of gathering, organizing data, and analyzing data, we can transform a seemingly chaotic collection of numbers into valuable information. These measures enable us to summarize large amounts of data, make comparisons, identify trends, and draw conclusions that can inform decisions and deepen our understanding of the world around us.
Range: Measuring Data Spread
Range is a fundamental concept in statistics that helps us understand the data spread measurement or variation of data within a dataset. It is defined as the difference between the highest and lowest numbers in a set of values. This simple yet powerful measure provides valuable insights into the dispersion of data points and is often used as a quick indicator of data variability.
To calculate the range, we use a straightforward formula: Range = Highest value - Lowest value. This calculation gives us a single number that represents the entire span of the dataset. For example, in a water drinking survey mentioned in the video, if the highest amount of water consumed by a participant is 8 glasses and the lowest is 2 glasses, the range would be 8 - 2 = 6 glasses.
The range helps in understanding the data spread measurement by showing the full extent of variation within a dataset. A larger range indicates a wider spread of values, while a smaller range suggests that the data points are more closely clustered together. This information is particularly useful when comparing different datasets or when assessing the consistency of measurements.
However, it's important to note that while the range provides a quick overview of data spread, it has limitations. It only considers the two extreme values and doesn't account for the distribution of data points between these extremes. This means that outliers effect on range can significantly affect the range, potentially giving a misleading impression of the overall data spread.
Despite its limitations, the range remains a valuable tool in data analysis. It's often used in conjunction with other measures of central tendency and dispersion to provide a more comprehensive understanding of data distribution. In fields such as quality control, environmental monitoring, and market research, the range can offer quick insights into data variability, helping researchers and analysts make informed decisions.
Understanding the range is crucial for interpreting data in various contexts. For instance, in the water drinking survey example, a range of 6 glasses indicates significant variation in water consumption habits among participants. This information could be valuable for health researchers studying hydration patterns or for marketers developing targeted campaigns for water consumption.
In conclusion, the range is a simple yet effective measure for assessing data spread and variation. By calculating the difference between the highest and lowest values in a dataset, we can quickly gauge the extent of data dispersion. While it has its limitations, the range remains an essential tool in the statistician's toolkit, providing valuable insights into outliers effect on range across various fields and applications.
Median: Finding the Middle Value
The median is a crucial statistical measure that represents the middle value in an ordered data set. It's an essential concept in data analysis, providing valuable insights into the central tendency of a distribution. Understanding how to calculate the median and its significance is fundamental for anyone working with data.
To find the median, the first step is to arrange the data points in order from least to greatest. This ordering is critical as it allows us to identify the middle value accurately. Once the data is ordered, the process of finding the median differs slightly depending on whether there's an odd or even number of data points.
For a data set with an odd number of values, the median is straightforward to determine. It's simply the middle number in the ordered list. For example, in the data set (2, 5, 7, 8, 10), the median is 7. This middle value divides the data set into two equal halves, with an equal number of values above and below it.
When dealing with an even number of data points, the process is slightly different. In this case, there are two middle numbers. To find the median for even number of values, we take these two middle numbers and calculate their average. For instance, in the data set (3, 4, 6, 8, 9, 11), the two middle numbers are 6 and 8. The median would be the average of these two numbers: (6 + 8) / 2 = 7.
It's important to note that the median is not affected by extreme values or outliers in the same way that the mean (average) is. This makes the median particularly useful for skewed distributions or data sets with outliers. For example, in a data set of salaries where there are a few extremely high earners, the median gives a more representative picture of the typical salary than the mean would.
The process of finding the median highlights the importance of ordering data. Without arranging the values from least to greatest, it would be impossible to accurately identify the middle value or values. This ordering step is crucial and should never be overlooked when calculating the median.
The median provides valuable information about the central point of data. It effectively splits the data set in half, with 50% of the values falling below the median and 50% above it. This characteristic makes the median an excellent measure of central tendency, especially for ordinal data or when dealing with skewed distributions.
In practical applications, the median is widely used. For instance, in reporting housing prices, the median is often preferred over the mean. This is because a few extremely expensive houses can significantly skew the average, while the median remains a more accurate representation of the typical house price in an area.
Understanding the concept of median also paves the way for grasping more advanced statistical concepts. For example, the interquartile range, which measures the spread of the middle 50% of a data set, is calculated using the median as a reference point.
To illustrate the process of finding the median, let's consider a practical example. Suppose we have the following set of test scores: (65, 70, 75, 80, 85, 90, 95). To find the median, we first confirm that the data is already ordered from least to greatest. Since there are seven scores (an odd number), the median will be the middle score. Counting from either end, we find that 80 is the middle score, making it the median.
Now, let's look at an example with an even number of data points. Consider the daily temperatures for a week: (68, 72, 75, 77, 79, 81). Here, we have six temperatures (an even number). The two middle numbers are 75 and 77. To find the median for even number of values, we calculate their average: (75 + 77) / 2 = 76. Therefore, the median temperature for the week is 76 degrees.
In conclusion, the median is a powerful tool in statistical analysis, offering a robust measure of central tendency. Its ability to represent the middle value of a data set, regardless of extreme values, makes it invaluable in many real-world applications. By understanding how to calculate the median for both odd and even numbers of data points and recognizing the importance of ordered data, you'll be well-equipped to interpret and analyze various types of data.
Mode: Identifying the Most Common Value
Mode is a crucial statistical measure that represents the most frequently occurring value in a data set. It provides valuable insights into the most common or typical value within a collection of numbers or categories. To identify the mode, one must examine the frequency of each value and determine which appears most often. This process is particularly useful when dealing with both numerical and categorical data.
In the water drinking survey example from the video, participants were asked how many glasses of water they consume daily. The responses might include values like 2, 3, 4, 5, and 6 glasses. If more people reported drinking 4 glasses than any other amount, then 4 would be the mode of this data set. This information helps researchers understand the most common water consumption habit among the surveyed population.
It's important to note that a data set can have more than one mode. When two values occur with equal highest frequency, the data is considered bimodal. For instance, if an equal number of people reported drinking 3 and 4 glasses of water, both 3 and 4 would be modes. In some cases, a data set might even have three or more modes, referred to as multimodal data.
The mode is particularly useful in understanding the most typical value in a data set, especially when dealing with categorical data or when the mean and median might be skewed by extreme values. For example, in a survey about favorite colors, the mode would clearly indicate the most popular choice among respondents. In retail, identifying the mode of sold items can help in inventory management and marketing strategies.
Understanding the mode helps in various real-world applications. In market research, it can reveal the most common preferences or behaviors. In quality control, the mode can highlight the most frequent defect type. In education, it can show the most common test score, helping teachers gauge overall class performance. The mode's ability to represent the most frequent occurrence makes it an invaluable tool in data analysis, providing a quick and intuitive understanding of data trends and patterns.
Mean: Calculating the Average
The concept of mean, commonly known as average, is a fundamental statistical measure that provides a balanced central value for a set of numbers. Understanding how to calculate and interpret the mean is crucial in various fields, from mathematics and science to everyday decision-making. Let's delve into the intricacies of mean and explore its calculation process.
The mean is calculated using a simple formula: Mean = Sum of all values / Number of values. This straightforward equation allows us to find a single value that represents the central tendency of a dataset. To calculate the mean, follow these step-by-step instructions:
- Gather all the values in your dataset.
- Add up all the values to get the sum.
- Count the total number of values in your dataset.
- Divide the sum by the number of values.
Let's illustrate this process with an example from the video. Imagine we have a set of five numbers: 2, 4, 6, 8, and 10. To calculate the mean:
- Sum of all values: 2 + 4 + 6 + 8 + 10 = 30
- Number of values: 5
- Mean = 30 / 5 = 6
In this case, the mean of our dataset is 6. This value provides a balanced central point that takes all data points into account. It's important to note that the mean is influenced by every value in the dataset, making it a comprehensive measure of central tendency.
The mean offers several advantages as a statistical measure. It provides a single, easily understood value that represents the entire dataset. This makes it particularly useful for comparing different sets of data or tracking changes over time. Additionally, the mean takes into account all values in a dataset, ensuring that no information is lost in the calculation.
However, it's worth noting that the mean can be sensitive to extreme values or outliers in a dataset. These outliers can significantly impact the calculated average, potentially skewing the representation of the central tendency. In such cases, other measures like median or mode might be more appropriate.
The video provides a visual representation of the mean using block stacks, which helps to illustrate the concept more tangibly. Imagine each number in our dataset represented by a stack of blocks. To find the mean visually:
- Create stacks of blocks for each number in the dataset.
- Redistribute the blocks evenly among all stacks.
- The height of each stack after redistribution represents the mean.
This visual approach demonstrates how the mean equalizes the values across the dataset, creating a balanced representation of all data points. It reinforces the idea that the mean is a central value that takes into account all the information in the dataset.
Understanding and calculating the mean is essential in various real-world applications. In education, it's used to calculate average grades. In business, it helps determine average sales or customer satisfaction scores. In science, it's crucial for analyzing experimental results and identifying trends in data.
To become proficient in working with means, practice calculating them for different datasets. Start with small sets of numbers and gradually move to larger, more complex datasets. Pay attention to how different values affect the mean and consider how outliers might impact your results.
In conclusion, the mean is a powerful tool for summarizing data and understanding central tendencies. By mastering the calculation and interpretation of means, you'll be better equipped to analyze data, make informed decisions, and draw meaningful conclusions across various fields and applications.
Comparing and Applying Measures of Central Tendency
In data analysis, understanding when to use different measures of central tendency is crucial for accurate interpretation and decision-making. The mean, median, mode, and range each provide unique insights into a dataset, and choosing the appropriate measure depends on the nature of the data and the specific question being addressed.
The mean, often referred to as the average, is widely used and easily understood. It's calculated by summing all values and dividing by the number of observations. The mean is ideal for normally distributed data and provides a good overall representation of the dataset. However, it's sensitive to extreme values or outliers, which can skew the results. For example, in analyzing household incomes, a few extremely high earners can significantly inflate the mean, potentially misrepresenting the typical income.
The median, the middle value when data is ordered, is less affected by outliers and skewed distributions. It's particularly useful for datasets with extreme values or when dealing with ordinal data. In the video example of analyzing test scores, the median might provide a more accurate representation of typical student performance if there are a few exceptionally high or low scores.
The mode, the most frequently occurring value, is valuable for categorical data or when identifying the most common result is important. In survey analysis, the mode can reveal the most popular opinion or choice. For instance, in a customer satisfaction survey, the mode would indicate the most common rating given by respondents.
The range, while not a measure of central tendency, complements these measures by providing insight into data spread. It's calculated as the difference between the highest and lowest values. In experimental data, the range can indicate variability in results, which is crucial for assessing consistency and reliability.
Choosing the appropriate measure depends on several factors. For symmetric distributions, the mean is often preferred as it uses all data points. However, for skewed distributions or data with outliers, the median may be more representative. In cases where the data is categorical or discrete, the mode might be the only applicable measure.
Real-world applications demonstrate the importance of selecting the right measure. In analyzing salaries within a company, the median might be more informative than the mean, especially if there are a few very high-earning executives. For customer ratings of a product, the mode could reveal the most common satisfaction level, while the mean might provide an overall sentiment score.
It's often beneficial to use multiple measures in conjunction. For example, in analyzing student test scores, reporting the mean, median, and mode together can provide a comprehensive view of performance. The mean gives an overall average, the median shows the middle score, and the mode indicates the most common score. Adding the range can further illustrate the spread of scores.
In conclusion, each measure of central tendency offers unique insights into data. The mean provides an overall average but can be skewed by outliers. The median offers a robust measure of the center, especially for skewed data. The mode is valuable for categorical data and identifying the most common result. The range complements these by showing data spread. By understanding the strengths and limitations of each measure, analysts can choose the most appropriate tool for their specific data and research questions, leading to more accurate interpretations and informed decision-making in various fields, from business and education to scientific research.
Conclusion: Mastering Measures of Central Tendency
In this comprehensive exploration of mean, median, mode, and range, we've uncovered the fundamental tools for understanding data distribution. The mean provides an average, the median identifies the middle value, the mode highlights the most frequent occurrence, and the range showcases data spread. These measures are crucial in data analysis and statistics, offering insights into data characteristics and trends. By mastering these concepts, you'll enhance your ability to interpret and draw meaningful conclusions from various datasets. We encourage you to practice calculating these measures using your own data sets, as hands-on experience is key to solidifying your understanding. Remember, the introduction video laid the groundwork for these concepts, and revisiting it can reinforce your learning. As you continue your journey in data analysis, these measures of central tendency will serve as invaluable tools in your statistical toolkit, enabling you to make informed decisions and uncover hidden patterns in data.
Introduction to Mean, Median, Mode and Range:
Analyzing data sets: what are the measures of central tendency?
Step 1: Understanding Measures of Central Tendency
In this lesson, we will be learning about four key concepts: mean, median, mode, and range. These concepts are all measures of central tendency, which means they provide information about a whole group of data. When we have a large data set and want to extract meaningful information from it, we use these measures to analyze and understand the data.
Step 2: Defining a Data Set
A data set is a collection of numbers, objects, or observations. For example, if you conduct a survey or an experiment, you will gather a data set. This data set can be used to answer specific questions or to analyze trends and patterns. For instance, if you want to find out how tall your friends are, you would collect their height measurements, which would form your data set.
Step 3: Small vs. Large Data Sets
When dealing with a small data set, it is relatively easy to extract information. For example, if you have the heights of a few friends, you can quickly identify the tallest, shortest, and middle-sized individuals. However, as the data set grows larger, it becomes more challenging to analyze and make sense of the information. For instance, if you want to know the heights of all students in a school with 400 students, the data set becomes much more complex.
Step 4: The Importance of Mean, Median, Mode, and Range
To make sense of large data sets, we use the concepts of mean, median, mode, and range. These measures help us summarize and understand the data more effectively. The mean provides the average value, the median gives the middle value, the mode identifies the most frequently occurring value, and the range shows the difference between the highest and lowest values. These measures allow us to draw meaningful conclusions from the data.
Step 5: Collecting and Organizing Data
The first step in analyzing data is to collect it. Once you have gathered your data, you need to organize it. This can be done using various methods, such as tables, charts, or diagrams. Organizing the data helps in visualizing it and makes it easier to analyze. For example, you can use Venn diagrams, tables, or pictographs to represent your data visually.
Step 6: Analyzing the Data
After collecting and organizing the data, the next step is to analyze it. This involves calculating the mean, median, mode, and range to extract meaningful information. Analyzing the data helps in understanding the trends, patterns, and overall characteristics of the data set. This is especially important in studies or experiments where data analysis is crucial for drawing conclusions and making informed decisions.
Step 7: Drawing Conclusions
The final step is to draw conclusions based on the analysis. By understanding the mean, median, mode, and range, you can make sense of the data and learn valuable insights. For example, you can determine the average height of students in a school, identify the most common height, and understand the variation in heights. These conclusions help in making informed decisions and understanding the overall trends in the data.
Summary
In summary, the concepts of mean, median, mode, and range are essential for analyzing data sets. They provide measures of central tendency that help in understanding and summarizing large data sets. By collecting, organizing, and analyzing data, we can draw meaningful conclusions and gain valuable insights. These concepts are fundamental in various fields, including statistics, research, and data analysis.
FAQs
-
What is the difference between mean, median, and mode?
The mean is the average of all values in a dataset, calculated by summing all values and dividing by the number of values. The median is the middle value when the data is ordered from least to greatest. The mode is the most frequently occurring value in the dataset. Each measure provides different insights: the mean gives an overall average, the median represents the central value, and the mode shows the most common value.
-
When should I use the median instead of the mean?
The median is preferable when dealing with skewed data or datasets with extreme outliers. It's less affected by these extreme values compared to the mean. For example, in analyzing income data where there might be a few very high earners, the median gives a better representation of the typical income than the mean, which can be significantly pulled up by the high values.
-
How do I calculate the range, and what does it tell me?
The range is calculated by subtracting the lowest value from the highest value in a dataset. For example, if the highest value is 100 and the lowest is 20, the range is 100 - 20 = 80. The range provides information about the spread or dispersion of the data. A larger range indicates more variability in the data, while a smaller range suggests the data points are more closely clustered.
-
Can a dataset have more than one mode?
Yes, a dataset can have more than one mode. When a dataset has two modes, it's called bimodal. If it has three or more modes, it's referred to as multimodal. For instance, in a dataset of favorite colors (red, blue, green, blue, red), both red and blue are modes. This is particularly common in categorical data or discrete numerical data.
-
How do these measures of central tendency help in real-world data analysis?
These measures are crucial for summarizing and interpreting data in various fields. In business, they can help analyze sales trends or customer satisfaction. In education, they're used to assess student performance. In scientific research, they help in analyzing experimental results. For example, a company might use the mean to calculate average sales, the median to determine the typical customer spend (especially if there are some very large purchases), and the mode to identify the most popular product.
Prerequisite Topics
Before diving into the world of mean, median, mode, and range, it's crucial to understand the foundational concepts that pave the way for these statistical measures. A solid grasp of prerequisite topics not only enhances your comprehension but also provides a broader context for data analysis.
One essential prerequisite is understanding influencing factors in data collection. This knowledge is vital because the quality and reliability of your data directly impact the accuracy of mean, median, mode, and range calculations. By recognizing various data collection methods and their potential biases, you'll be better equipped to interpret statistical results critically.
Another key prerequisite is organizing data. Proficiency in organizing data sets is fundamental when working with mean, median, mode, and range. These measures require data to be systematically arranged for accurate calculation and meaningful interpretation. Understanding how to structure and categorize information lays the groundwork for efficient statistical analysis.
Lastly, a basic understanding of probability is invaluable. Familiarity with frequency distribution tables, a core concept in probability, directly relates to calculating and interpreting mean, median, mode, and range. These statistical measures often involve analyzing the distribution of data points, making probability knowledge essential for a comprehensive understanding.
The interplay between these prerequisites and the main topic is significant. For instance, when calculating the mean of a dataset, you'll need to consider how the data was collected and organized. The median, being the middle value in a sorted dataset, relies heavily on proper data organization. The mode, as the most frequent value, is closely tied to concepts of frequency distribution in probability. Lastly, the range, which measures data spread, is influenced by data collection methods and organization techniques.
By mastering these prerequisite topics, you'll develop a more nuanced understanding of mean, median, mode, and range. You'll be able to critically evaluate data sources, efficiently organize information for analysis, and interpret results within the context of probability distributions. This comprehensive approach not only enhances your statistical skills but also prepares you for more advanced concepts in data analysis and interpretation.
Remember, statistics is not just about crunching numbers; it's about understanding the story behind the data. The prerequisite topics provide you with the tools to read between the lines, ask the right questions, and draw meaningful conclusions from your analyses. As you embark on your journey to master mean, median, mode, and range, keep in mind that your foundation in these prerequisite areas will be your greatest asset in becoming a skilled statistician.