Overview
Watch
Read
Next Steps
Read
Mastering Logarithmic Functions: From Graphs to Equations
In this article, we've explored the fascinating world of logarithmic functions and their graphical representations. We've learned how to identify these functions from their distinctive curved shapes and asymptotic behavior. The introduction video provided a crucial foundation for understanding these concepts, making it an essential starting point for anyone new to the topic. As you continue your journey with logarithmic functions, practice is key. Challenge yourself to identify these functions from various graphs, paying close attention to their unique characteristics. Remember, the more you engage with these concepts, the more intuitive they'll become. We encourage you to explore further resources, solve practice problems, and discuss your findings with peers or instructors. By mastering logarithmic functions and their graphs, you'll unlock a powerful tool for analyzing exponential growth and decay in various real-world applications. Keep exploring, and don't hesitate to revisit this article and the introductory video as needed to reinforce your understanding.
Example:
Determining the Equation of a Transformed Logarithmic function given its Graph
Determine a logarithmic function in the form \(y = \log_{2}(x + b) + c\) for each of the given graphs.
Step 1: Understanding the Form of the Logarithmic Function
We start by understanding the form of the logarithmic function we need to determine. The function is given in the form \(y = \log_{2}(x + b) + c\). Here, \(b\) represents the horizontal shift, and \(c\) represents the vertical shift. Our goal is to find the values of \(b\) and \(c\) that transform the reference graph \(y = \log_{2}(x)\) to match the given graph.
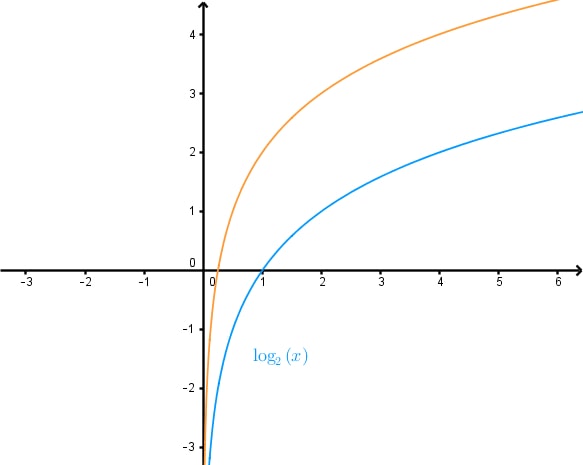
Step 2: Analyzing the Reference Graph
We use the reference graph of \(y = \log_{2}(x)\) to understand the transformations. The reference graph passes through the point (1, 0) and has a vertical asymptote at \(x = 0\). This information helps us identify any shifts in the given graph.
Step 3: Identifying the Vertical Asymptote
Next, we examine the vertical asymptote of the given graph. If the vertical asymptote remains at \(x = 0\), it indicates that there is no horizontal shift. In this case, the value of \(b\) would be 0. If the vertical asymptote has shifted, we would need to determine the value of \(b\) accordingly.
Step 4: Determining the Horizontal Shift (b)
In the given graph, the vertical asymptote is still at \(x = 0\). This means there is no horizontal translation, and thus, \(b = 0\). We can now update our function to \(y = \log_{2}(x) + c\).
Step 5: Identifying the Vertical Shift (c)
To determine the vertical shift, we look at how the points on the reference graph have moved vertically. We observe that each point on the reference graph has been translated vertically by a certain number of units. By counting the units of vertical translation, we can determine the value of \(c\).
Step 6: Calculating the Vertical Shift (c)
We notice that every point on the reference graph has been shifted vertically by 2 units upwards. This means the value of \(c\) is 2. Therefore, our updated function becomes \(y = \log_{2}(x) + 2\).
Step 7: Verifying the Transformation
Finally, we verify our transformation by checking if the updated function \(y = \log_{2}(x) + 2\) matches the given graph. We ensure that the vertical asymptote remains at \(x = 0\) and that all points have been shifted correctly by 2 units upwards.
Conclusion
By following these steps, we have determined the equation of the transformed logarithmic function given its graph. The function is in the form \(y = \log_{2}(x + b) + c\), where \(b = 0\) and \(c = 2\). This process can be applied to other graphs to find their corresponding logarithmic functions.
FAQs
Here are some frequently asked questions about finding logarithmic functions from graphs:
1. What type of graph is logarithmic?
A logarithmic graph has a distinctive curved shape that starts with a steep increase (or decrease) and gradually levels off. It has a vertical asymptote on one side and extends infinitely in the other direction, never crossing the asymptote.
2. What is the logarithmic equation for a graph?
The general form of a logarithmic equation is y = a logb(x - h) + k, where 'a' is the vertical stretch factor, 'b' is the base of the logarithm, 'h' is the horizontal shift, and 'k' is the vertical shift.
3. How do you tell if a graph is exponential or logarithmic?
Logarithmic graphs have a vertical asymptote and level off as x increases, while exponential graphs have a horizontal asymptote and grow increasingly steep as x increases. Logarithmic graphs are essentially the reflection of exponential graphs over the line y = x.
4. What are the 4 steps to graph a log function?
1) Identify the vertical asymptote (x = h). 2) Plot the y-intercept (0, k). 3) Use the change of base formula to plot additional points. 4) Connect the points with a smooth curve that approaches but never touches the vertical asymptote.
5. How do you write the equation for a logarithmic function from a graph?
To write the equation: 1) Identify the vertical asymptote to find 'h'. 2) Locate the y-intercept to determine 'k'. 3) Use two points to calculate 'a' and 'b'. 4) Combine these elements into the general form y = a logb(x - h) + k.
Prerequisite Topics
Understanding the prerequisite topics is crucial when learning how to find a logarithmic function given its graph. These foundational concepts provide the necessary background to interpret and analyze logarithmic graphs effectively.
One of the key prerequisites is understanding the characteristics of polynomial graphs. While logarithmic functions are not polynomials, many of the graphing principles apply, such as identifying key points and understanding how the function behaves. This knowledge helps in recognizing the unique shape and properties of logarithmic graphs.
The concept of continuous growth and decay is particularly relevant to logarithmic functions. Logarithmic graphs often represent scenarios of continuous growth or decay, making this prerequisite essential for interpreting real-world applications of these functions.
Understanding vertical asymptotes is crucial when working with logarithmic graphs. Logarithmic functions typically have a vertical asymptote, and recognizing this feature is key to accurately sketching and analyzing these graphs.
While more advanced, knowledge of the derivative of logarithmic functions can provide insights into the rate of change and behavior of these functions, which can be helpful in understanding their graphs.
The concept of reflection across the y-axis is important when dealing with different forms of logarithmic functions, particularly when comparing graphs of logarithms with different bases.
Understanding horizontal and vertical distances on a graph is fundamental to interpreting logarithmic scales and transformations of logarithmic functions.
Familiarity with logarithmic scales, such as the dB scale, provides practical context for logarithmic functions and enhances understanding of their real-world applications.
By mastering these prerequisite topics, students will be better equipped to analyze and interpret logarithmic graphs, making the process of finding a logarithmic function from its graph more intuitive and manageable. Each of these concepts contributes to a comprehensive understanding of logarithmic behavior, enabling students to approach more complex problems with confidence and clarity.